Supported by Dr. Osamu Ogasawara and  . . |
|
Last data update: 2014.03.03 |
Evaluate SNPsDescriptionFunction to analyze a MassArrayData object for all potential single nucleotide polymorphisms (SNPs) indicated by new and/or missing peaks in the the spectral data for one or more samples UsageevaluateSNPs(x, verbose = TRUE, plot = TRUE) Arguments
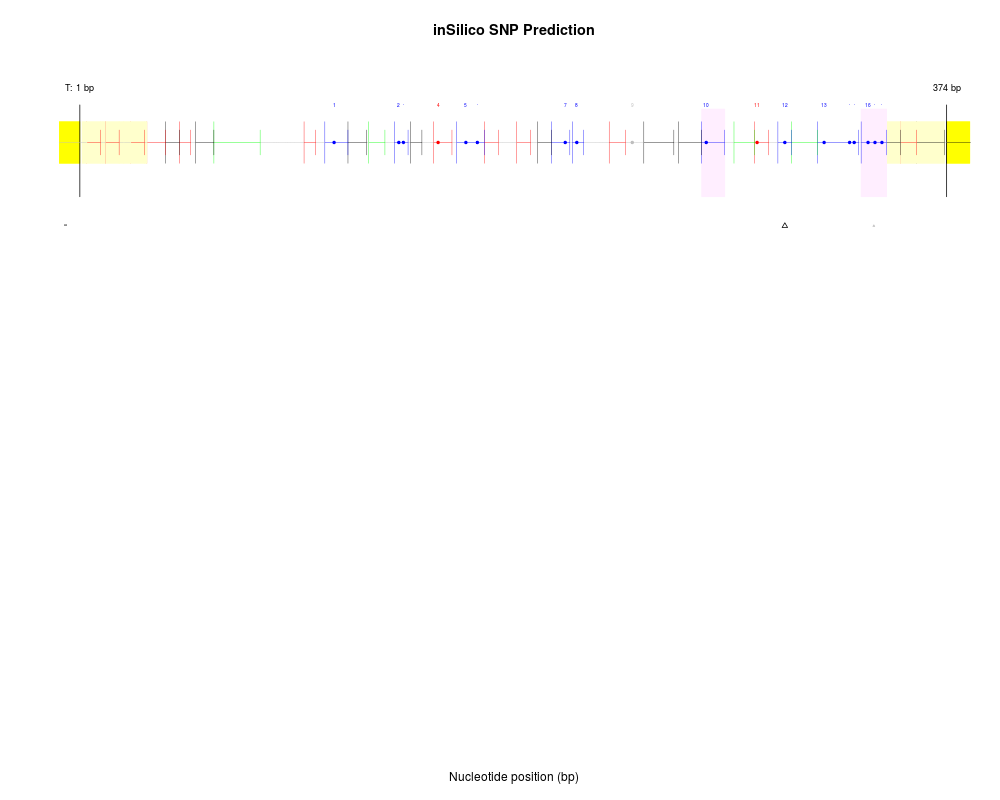
DetailsThis function performs an exhaustive search for all potential SNPs (single base pair substitutions or deletions) that may give rise to new and/or missing peaks. Graphical output is displayed by default, and extensive data describing putative SNPs is also returned. Note that the graphical output does not contain a built-in legend at this time, but the plot may be interepreted as follows: In the uppermost panel the T-cleavage fragmentation profile is shown for a given amplicon (C-cleavage reactions occupy a split screen whenever relevant). CG dinucleotides (filled circles) are numbered and colored in blue. Other fragments are colored according to their ability to be assayed: fragment molecular weight outside the testable mass window (gray), fragment molecular weight overlapping with another fragment (red), fragment containing a potential conversion control (green), or fragment uniquely assayable but containing no CGs (black). Putative SNPs are shown directly below their location within the amplicon fragmentation profile. Each row represents analysis from a single sample. Small, gray symbols represent potential SNPs that do not have sufficient evidence (presence of a new peak with corresponding absence of an expected peak). Larger black symbols indicate a potential SNP with both new peaks and missing expected peaks. Triangles indicate base pair substitution, while circles indicate single base pair deletion. ValueReturns a list of potential SNPs for each identified new peak in the spectral data. Note that each new peak may be explained by any number of potential SNPs; the list returned only includes the most reliable hits, but the redundant nature of the data necessitates returning a nested list, such that each new peak is associated with the following list elements:
Author(s)Reid F. Thompson (rthompso@aecom.yu.edu), John M. Greally (jgreally@aecom.yu.edu) See Also See Also Examplesdata(MassArray.example.data) SNP.data <- evaluateSNPs(MassArray.example.data[2,]) Results
R version 3.3.1 (2016-06-21) -- "Bug in Your Hair"
Copyright (C) 2016 The R Foundation for Statistical Computing
Platform: x86_64-pc-linux-gnu (64-bit)

R is free software and comes with ABSOLUTELY NO WARRANTY.
You are welcome to redistribute it under certain conditions.
Type 'license()' or 'licence()' for distribution details.

R is a collaborative project with many contributors.
Type 'contributors()' for more information and
'citation()' on how to cite R or R packages in publications.

Type 'demo()' for some demos, 'help()' for on-line help, or
'help.start()' for an HTML browser interface to help.
Type 'q()' to quit R.

> library(MassArray)
> png(filename="/home/ddbj/snapshot/RGM3/R_BC/result/MassArray/evaluateSNPs.Rd_%03d_medium.png", width=480, height=480)
> ### Name: evaluateSNPs
> ### Title: Evaluate SNPs
> ### Aliases: evaluateSNPs
> ### Keywords: attribute manip
>
> ### ** Examples
>
> data(MassArray.example.data)
> SNP.data <- evaluateSNPs(MassArray.example.data[2,])
Examining T reaction for SNPs: 1 samples, 10 'NEW' peaks ... [1] "done"
FINISHED (11 potential SNPs identified)
>
>
>
>
>
> dev.off()
null device
          1
>
|