Determine whether to include the nearby small peaks of major peaks. TRUE by default
peakScaleRange
the scale range of the peak. larger than 5 by default.
amp.Th
the minimum required relative amplitude of the peak (ratio to the maximum of CWT coefficients)
minNoiseLevel
the minimum noise level used in computing the SNR
ridgeLength
the minimum highest scale of the peak in 2-D CWT coefficient matrix
peakThr
Minimal absolute intensity (above the baseline) of peaks to be picked. If this value is provided, then the smoothing function sav.gol will be called to estimate the local intensity.(added based on the suggestion and code of Steffen Neumann)
tuneIn
determine whether to tune in the parameter estimation of the detected peaks
...
other parameters used by identifyMajorPeaks and smoothing function sav.gol
Value
majorPeakInfo
return of identifyMajorPeaks
ridgeList
return of getRidge
localMax
return of getLocalMaximumCWT
wCoefs
2-D CWT coefficient matrix, see cwt for details.
Author(s)
Pan Du, Simon Lin
References
Du, P., Kibbe, W.A. and Lin, S.M. (2006) Improved peak detection in mass spectrum by incorporating continuous wavelet transform-based pattern matching, Bioinformatics, 22, 2059-2065.
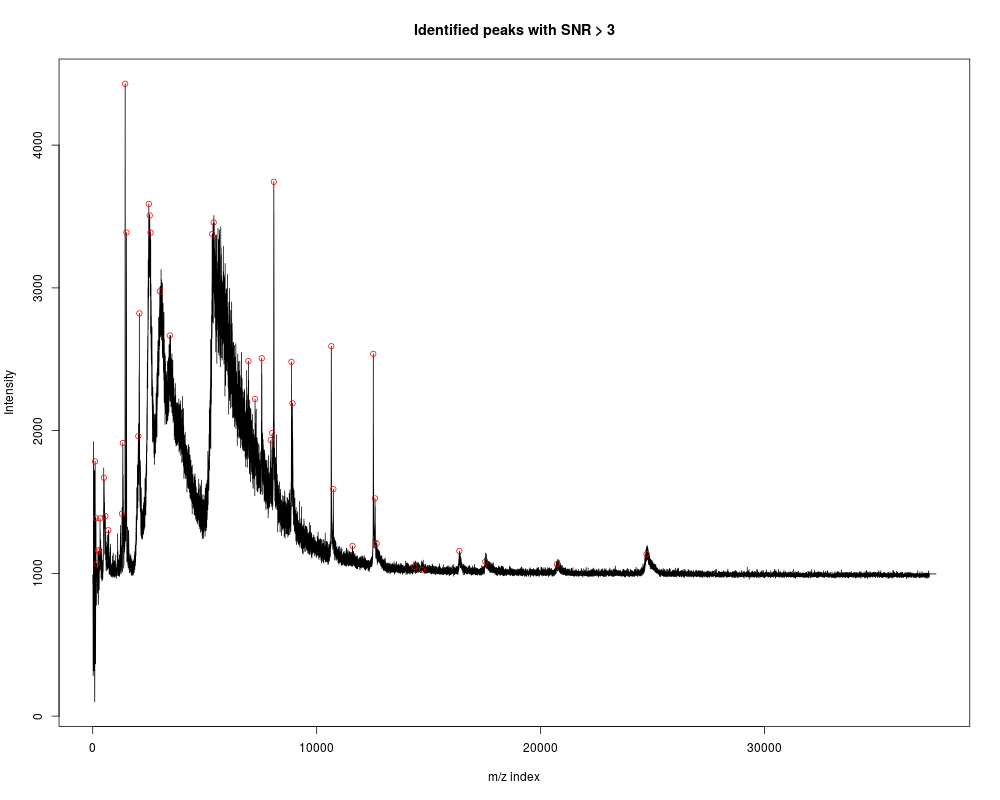
data(exampleMS)
SNR.Th <- 3
peakInfo <- peakDetectionCWT(exampleMS, SNR.Th=SNR.Th)
majorPeakInfo = peakInfo$majorPeakInfo
peakIndex <- majorPeakInfo$peakIndex
plotPeak(exampleMS, peakIndex, main=paste('Identified peaks with SNR >', SNR.Th))
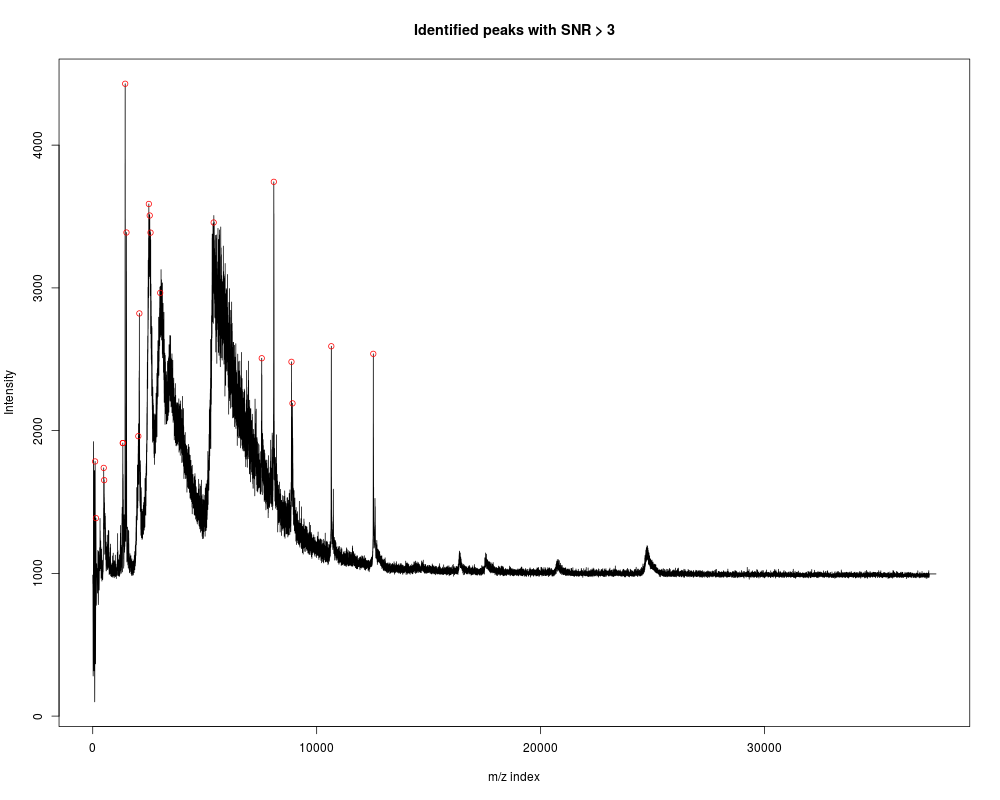
## In some cases, users may want to add peak filtering based on the absolute peak amplitude
peakInfo <- peakDetectionCWT(exampleMS, SNR.Th=SNR.Th, peakThr=500)
majorPeakInfo = peakInfo$majorPeakInfo
peakIndex <- majorPeakInfo$peakIndex
plotPeak(exampleMS, peakIndex, main=paste('Identified peaks with SNR >', SNR.Th))
Results
R version 3.3.1 (2016-06-21) -- "Bug in Your Hair"
Copyright (C) 2016 The R Foundation for Statistical Computing
Platform: x86_64-pc-linux-gnu (64-bit)

R is free software and comes with ABSOLUTELY NO WARRANTY.
You are welcome to redistribute it under certain conditions.
Type 'license()' or 'licence()' for distribution details.

R is a collaborative project with many contributors.
Type 'contributors()' for more information and
'citation()' on how to cite R or R packages in publications.

Type 'demo()' for some demos, 'help()' for on-line help, or
'help.start()' for an HTML browser interface to help.
Type 'q()' to quit R.

> library(MassSpecWavelet)
Loading required package: waveslim

waveslim: Wavelet Method for 1/2/3D Signals (version = 1.7.5)

> png(filename="/home/ddbj/snapshot/RGM3/R_BC/result/MassSpecWavelet/peakDetectionCWT.Rd_%03d_medium.png", width=480, height=480)
> ### Name: peakDetectionCWT
> ### Title: The main function of peak detection by CWT based pattern
> ###   matching
> ### Aliases: peakDetectionCWT
> ### Keywords: methods
>
> ### ** Examples
>
> 	data(exampleMS)
> 	SNR.Th <- 3
> 	peakInfo <- peakDetectionCWT(exampleMS, SNR.Th=SNR.Th)
> 	majorPeakInfo = peakInfo$majorPeakInfo
> 	peakIndex <- majorPeakInfo$peakIndex
> 	plotPeak(exampleMS, peakIndex, main=paste('Identified peaks with SNR >', SNR.Th))
>
> 	## In some cases, users may want to add peak filtering based on the absolute peak amplitude
> 	peakInfo <- peakDetectionCWT(exampleMS, SNR.Th=SNR.Th, peakThr=500)
> 	majorPeakInfo = peakInfo$majorPeakInfo
> 	peakIndex <- majorPeakInfo$peakIndex
> 	plotPeak(exampleMS, peakIndex, main=paste('Identified peaks with SNR >', SNR.Th))
>
>
>
>
>
> dev.off()
null device
          1
>
 .
.