Supported by Dr. Osamu Ogasawara and  . . |
|
Last data update: 2014.03.03 |
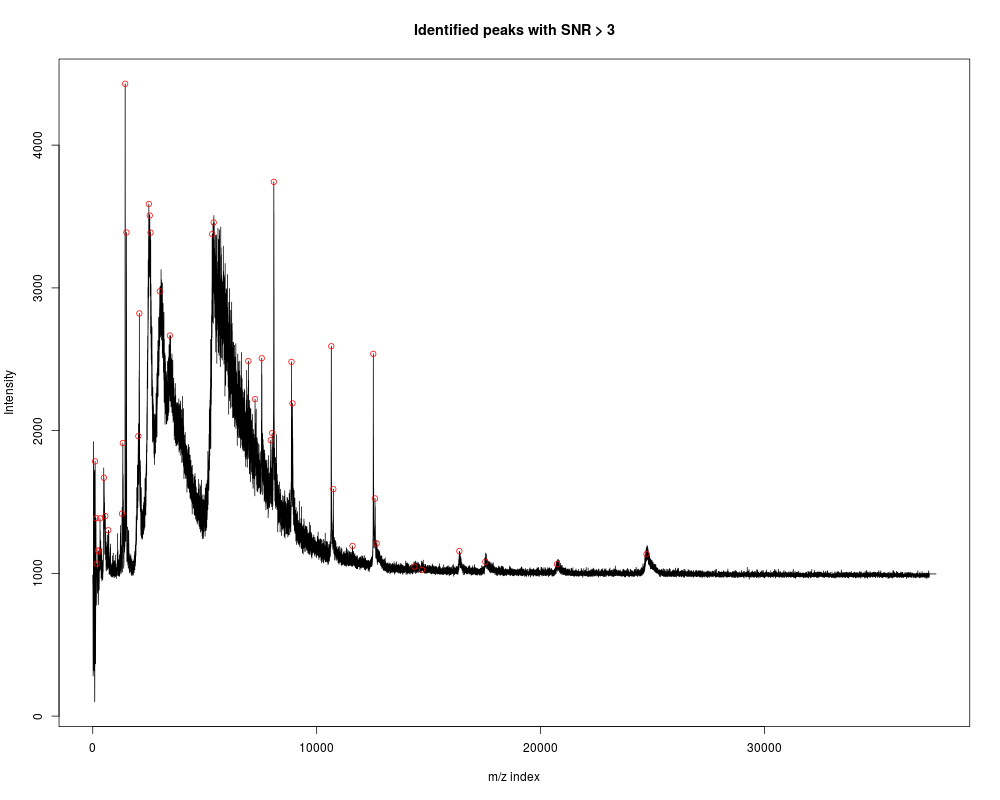
Plot the identified peaks over the spectrumDescriptionPlot the identified peaks over the spectrum. The identified peaks are returned by Usage
plotPeak(ms, peakIndex = NULL, mz = 1:length(ms), range = c(min(mz), max(mz)), method = c("p", "l"), main = NULL, log = "", ...)
Arguments
Author(s)Pan Du See Also
Examples
	data(exampleMS)
	SNR.Th <- 3
	peakInfo <- peakDetectionCWT(exampleMS, SNR.Th=SNR.Th)
	majorPeakInfo = peakInfo$majorPeakInfo
	peakIndex <- majorPeakInfo$peakIndex
	plotPeak(exampleMS, peakIndex, main=paste('Identified peaks with SNR >', SNR.Th))
Results
R version 3.3.1 (2016-06-21) -- "Bug in Your Hair"
Copyright (C) 2016 The R Foundation for Statistical Computing
Platform: x86_64-pc-linux-gnu (64-bit)

R is free software and comes with ABSOLUTELY NO WARRANTY.
You are welcome to redistribute it under certain conditions.
Type 'license()' or 'licence()' for distribution details.

R is a collaborative project with many contributors.
Type 'contributors()' for more information and
'citation()' on how to cite R or R packages in publications.

Type 'demo()' for some demos, 'help()' for on-line help, or
'help.start()' for an HTML browser interface to help.
Type 'q()' to quit R.

> library(MassSpecWavelet)
Loading required package: waveslim

waveslim: Wavelet Method for 1/2/3D Signals (version = 1.7.5)

> png(filename="/home/ddbj/snapshot/RGM3/R_BC/result/MassSpecWavelet/plotPeak.Rd_%03d_medium.png", width=480, height=480)
> ### Name: plotPeak
> ### Title: Plot the identified peaks over the spectrum
> ### Aliases: plotPeak
> ### Keywords: hplot
>
> ### ** Examples
>
> 	data(exampleMS)
> 	SNR.Th <- 3
> 	peakInfo <- peakDetectionCWT(exampleMS, SNR.Th=SNR.Th)
> 	majorPeakInfo = peakInfo$majorPeakInfo
> 	peakIndex <- majorPeakInfo$peakIndex
> 	plotPeak(exampleMS, peakIndex, main=paste('Identified peaks with SNR >', SNR.Th))
>
>
>
>
>
>
> dev.off()
null device
          1
>
|
Created & Maintained by Osamu Ogasawara (osamu.ogasawara@gmail.com) and 