Supported by Dr. Osamu Ogasawara and  . . |
|
Last data update: 2014.03.03 |
Tune in the peak information: peak position and peak scaleDescriptionBased on the identified peak position, more precise estimation of the peak information, i.e., peak position and peak scale, can be got by this function. The basic idea is to cut the segment of spectrum near the identified peaks, and then do similar procedures as UsagetuneInPeakInfo(ms, majorPeakInfo = NULL, peakIndex = NULL, peakScale = NULL, maxScale = 128, ...) Arguments
DetailsThe majorPeakInfo or peakIndex and peakScale must be provided. Value
Author(s)Pan Du ReferencesDu, P., Kibbe, W.A. and Lin, S.M. (2006) Improved peak detection in mass spectrum by incorporating continuous wavelet transform-based pattern matching, Bioinformatics, 22, 2059-2065. See Also
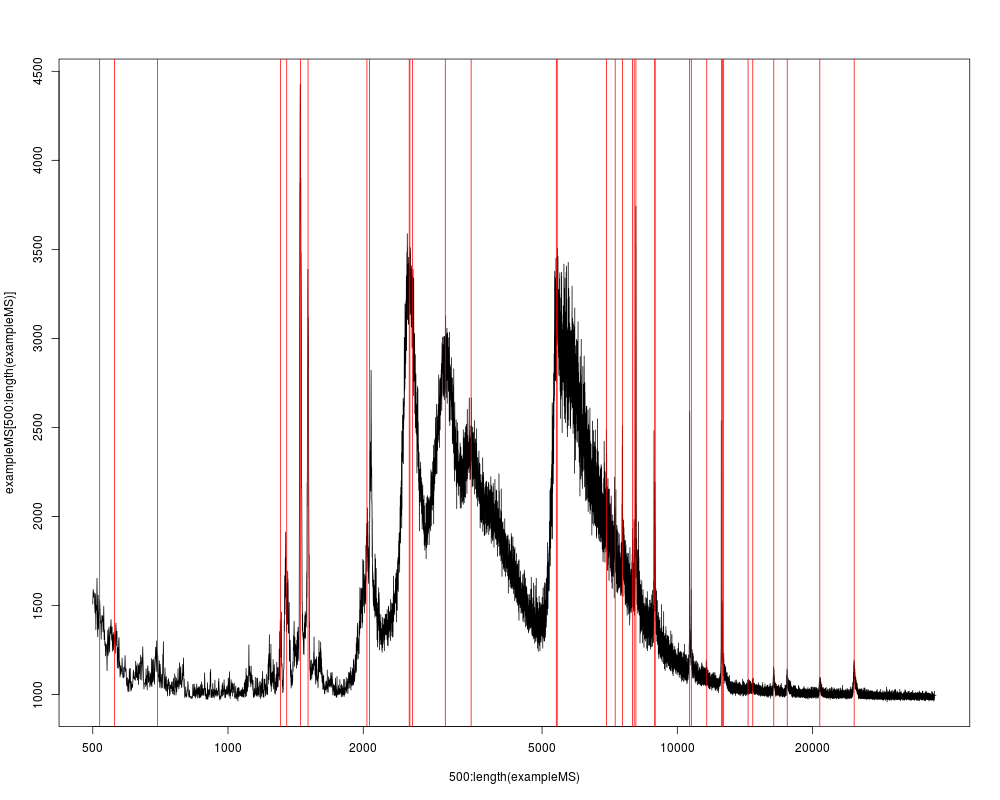
Examplesdata(exampleMS) SNR.Th <- 3 peakInfo <- peakDetectionCWT(exampleMS, SNR.Th=SNR.Th) majorPeakInfo <- peakInfo$majorPeakInfo betterPeakInfo <- tuneInPeakInfo(exampleMS, majorPeakInfo) plot(500:length(exampleMS), exampleMS[500:length(exampleMS)], type='l', log='x') abline(v=betterPeakInfo$peakCenterIndex, col='red') Results
R version 3.3.1 (2016-06-21) -- "Bug in Your Hair"
Copyright (C) 2016 The R Foundation for Statistical Computing
Platform: x86_64-pc-linux-gnu (64-bit)

R is free software and comes with ABSOLUTELY NO WARRANTY.
You are welcome to redistribute it under certain conditions.
Type 'license()' or 'licence()' for distribution details.

R is a collaborative project with many contributors.
Type 'contributors()' for more information and
'citation()' on how to cite R or R packages in publications.

Type 'demo()' for some demos, 'help()' for on-line help, or
'help.start()' for an HTML browser interface to help.
Type 'q()' to quit R.

> library(MassSpecWavelet)
Loading required package: waveslim

waveslim: Wavelet Method for 1/2/3D Signals (version = 1.7.5)

> png(filename="/home/ddbj/snapshot/RGM3/R_BC/result/MassSpecWavelet/tuneInPeakInfo.Rd_%03d_medium.png", width=480, height=480)
> ### Name: tuneInPeakInfo
> ### Title: Tune in the peak information: peak position and peak scale
> ### Aliases: tuneInPeakInfo
> ### Keywords: methods
>
> ### ** Examples
>
>
> 	data(exampleMS)
> 	SNR.Th <- 3
> 	peakInfo <- peakDetectionCWT(exampleMS, SNR.Th=SNR.Th)
> 	majorPeakInfo <- peakInfo$majorPeakInfo
> 	betterPeakInfo <- tuneInPeakInfo(exampleMS, majorPeakInfo)
> 	plot(500:length(exampleMS), exampleMS[500:length(exampleMS)], type='l', log='x')
> 	abline(v=betterPeakInfo$peakCenterIndex, col='red')
>
>
>
>
>
>
> dev.off()
null device
          1
>
|