Supported by Dr. Osamu Ogasawara and  . . |
|
Last data update: 2014.03.03 |
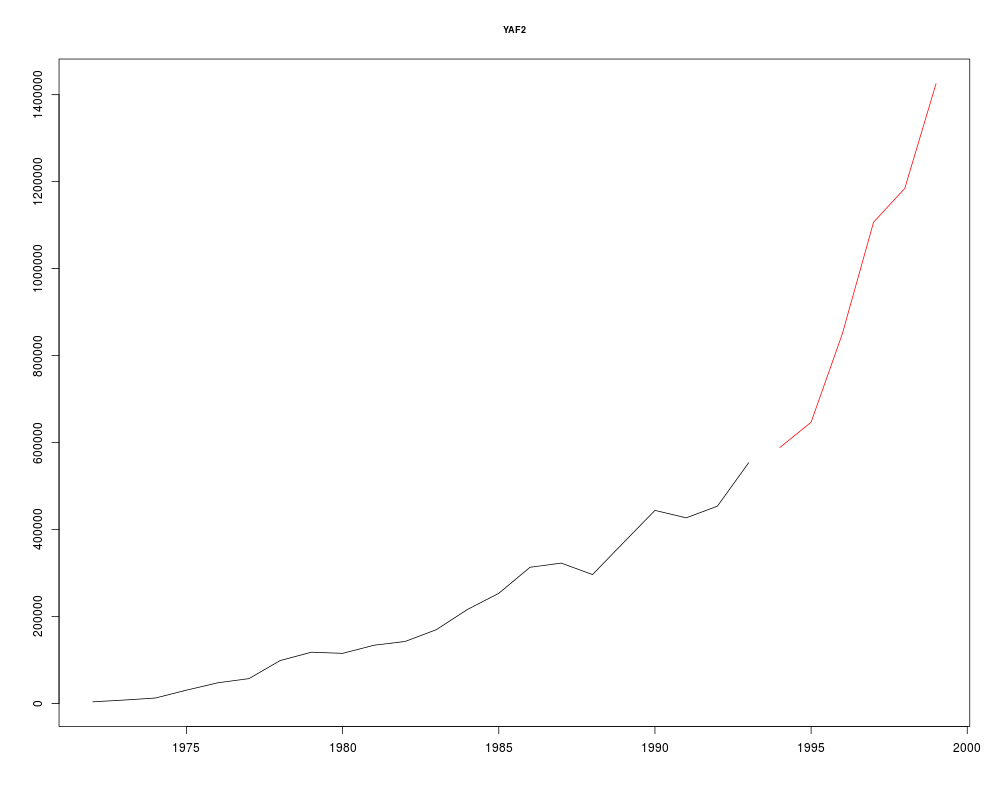
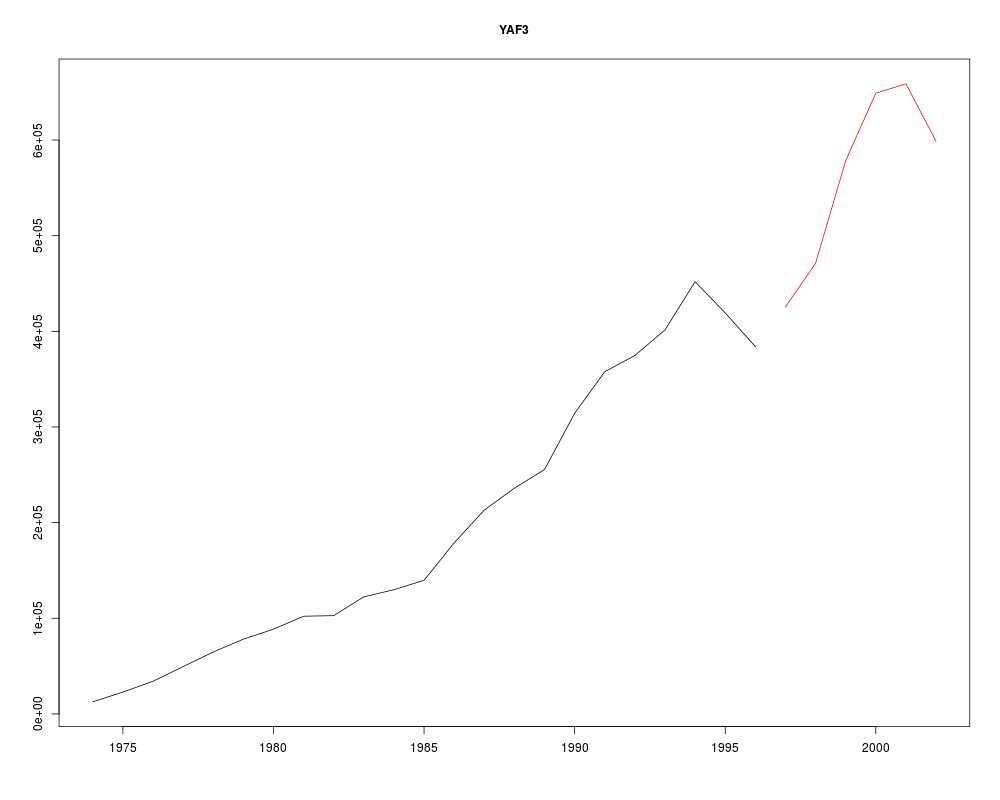
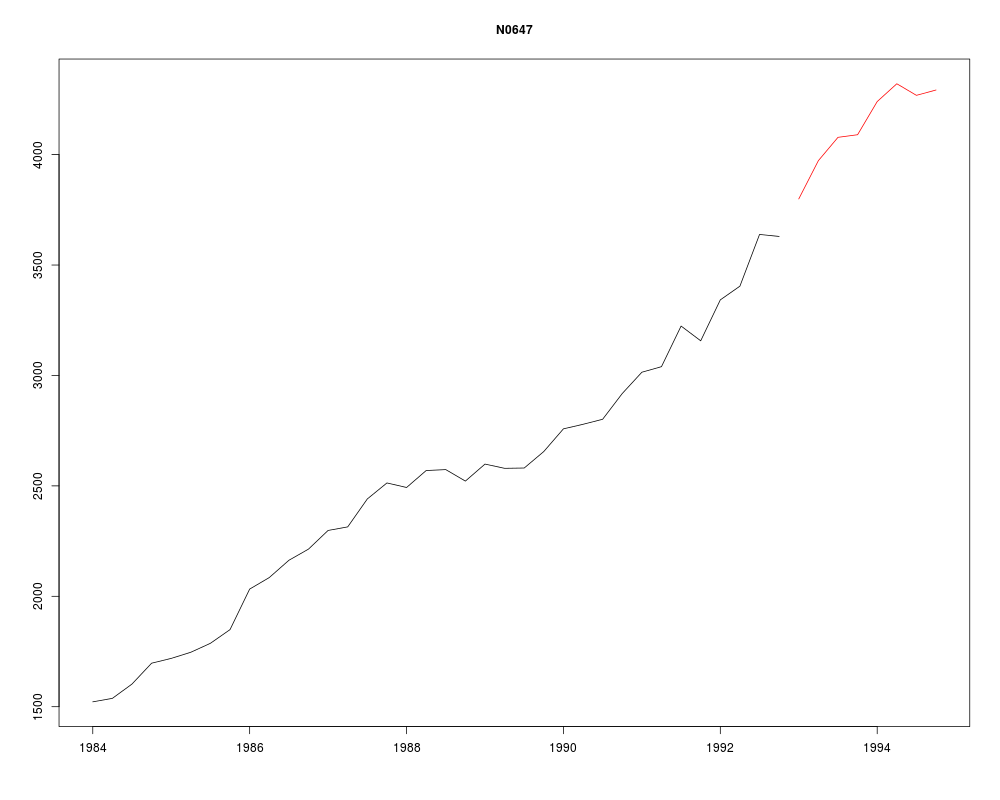
Plotting M Competition dataDescriptionplot.Mdata plots a time series from the M competition data sets. Usage
## S3 method for class 'Mdata'
plot(x, xlim=c(tsp(x$x)[1],tsp(x$xx)[2]), ylim=range(x$x,x$xx),
                   main=x$sn, xlab="", ylab="", ...)
Arguments
ValueNone. The function produces a time series plot of the selected series. Author(s)Muhammad Akram and Rob Hyndman See Also
Examplesplot(M1[[1]]) plot(M1$YAF3) plot(M3$N0647) Results
R version 3.3.1 (2016-06-21) -- "Bug in Your Hair"
Copyright (C) 2016 The R Foundation for Statistical Computing
Platform: x86_64-pc-linux-gnu (64-bit)

R is free software and comes with ABSOLUTELY NO WARRANTY.
You are welcome to redistribute it under certain conditions.
Type 'license()' or 'licence()' for distribution details.

R is a collaborative project with many contributors.
Type 'contributors()' for more information and
'citation()' on how to cite R or R packages in publications.

Type 'demo()' for some demos, 'help()' for on-line help, or
'help.start()' for an HTML browser interface to help.
Type 'q()' to quit R.

> library(Mcomp)
Loading required package: tseries
Loading required package: forecast
Loading required package: zoo

Attaching package: 'zoo'

The following objects are masked from 'package:base':

    as.Date, as.Date.numeric

Loading required package: timeDate
This is forecast 7.1

> png(filename="/home/ddbj/snapshot/RGM3/R_CC/result/Mcomp/plot.Mdata.Rd_%03d_medium.png", width=480, height=480)
> ### Name: plot.Mdata
> ### Title: Plotting M Competition data
> ### Aliases: plot.Mdata
> ### Keywords: hplot
>
> ### ** Examples
>
> plot(M1[[1]])
> plot(M1$YAF3)
> plot(M3$N0647)
>
>
>
>
>
> dev.off()
null device
          1
>
|
Created & Maintained by Osamu Ogasawara (osamu.ogasawara@gmail.com) and 