Supported by Dr. Osamu Ogasawara and  . . |
|
Last data update: 2014.03.03 |
MethPed: a DNA methylation classifier tool for the identification of pediatric brain tumor subtypes.DescriptionThe current version of MethPed can classify the following tumor diagnoses/subgroups: Diffuse Intrinsic Pontine Glioma (DIPG), Ependymoma, Embryonal tumors with multilayered rosettes (ETMR), Glioblastoma (GBM), Medulloblastoma (MB) - Group 3 (MB_Gr3), Group 4 (MB_Gr3), Group WNT (MB_WNT), Group SHH (MB_SHH) and Pilocytic Astrocytoma (PiloAstro). UsageMethPed(data, TargetID="TargetID", prob = TRUE,...) Arguments
DetailsClassification of pediatric tumors into biologically defined subtypes is challenging, and multifaceted approaches are needed. For this aim, we developed a diagnostic classifier based on DNA methylation profiles. We offer MethPed as an easy-to-use toolbox that allows researchers and clinical diagnosticians to test single samples as well as large cohorts for subclass prediction of pediatric brain tumors. The MethPed classifier uses the Random Forest (RF) algorithm to classify unknown pediatric brain tumor samples into sub-types. The classification proceeds with the selection of the beta values needed for the classification. The computational process proceeded in two stages. The first stage commences with a reduction of the probe pool or building the training probe dataset for classification. We have named this dataset as <c3><a2><c2><80><c2><9c>predictors<c3><a2><c2><80><c2><9d>. The second stage is to apply the RF algorithm to classify the probe data of interest based on the training probe dataset (predictors). For the construction of the training probe pool (predictors), methylation data generated by the Illumina Infinium HumanMethylation 450 BeadChip arrays were downloaded from the Gene Expression Omnibus (GEO). Four hundred seventy-two cases were available, representing several brain tumor diagnoses (DIPG, glioblastoma, ETMR, medulloblastoma, ependymoma, pilocytic astrocytoma) and their further subgroups. The data sets were merged and probes that did not appear in all data sets were filtered away. In addition, about 190,000 CpGs were removed due to SNPs, repeats and multiple mapping sites. The final data set contained 206,823 unique probes and nine tumor classes including the medulloblastoma subgroups. K<c3><a2><c2><80><c2><93>neighbor imputation was used for missing probe data. After that, a large number of regression analyses were performed to select the 100 probes per tumor class that had the highest predictive power (AUC values). Based on the identified 900 methylation sites, the nine pediatric brain tumor types could be accurately classified using the multiclass classification algorithm MethPed. ValueThe output of the algorithm is partitioned in 6 parts :
Author(s)Anna Danielsson, Mohammad Tanvir Ahamed, Szil<c3><83><c2><a1>rd Nemes and Helena Car<c3><83><c2><a9>n, University of Gothenburg, Sweden. References[1] Anna Danielsson, Szil<c3><83><c2><a1>rd Nemes, Magnus Tisell, Birgitta Lannering, Claes Nordborg, Magnus Sabel, and Helena Car<c3><83><c2><a9>n. "MethPed: A DNA Methylation Classifier Tool for the Identification of Pediatric Brain Tumor Subtypes". Clinical Epigenetics 2015, 7:62, 2015 [2] Breiman, Leo (2001). "Random Forests". Machine Learning 45 (1): 5-32. doi:10.1023/A:1010933404324 [3] Troyanskaya, O., M. Cantor, G. Sherlock, P. Brown, T. Hastie, R. Tibshirani, D. Botstein, and R. B. Altman. "Missing Value Estimation Methods for DNA Microarrays." Bioinformatics 17.6 (2001): 520-25. See AlsoSee http://www.clinicalepigeneticsjournal.com/content/7/1/62 for more details. Examples
#################### Loading and view sample data
data(MethPed_sample)
head(MethPed_sample,10)
#################### Check dimention of sample data
dim(MethPed_sample) # Check number pof probes and samples in data
#################### Checking missing value in the data
missingIndex <- checkNA(MethPed_sample)
#################### Apply MethPed to sample data (Probability for all tumor group)
myClassification<-MethPed(MethPed_sample)
myClassification<-MethPed(MethPed_sample,prob=TRUE)
#################### Apply MethPed to sample data (Only maximum probability expected)
myClassification_max<-MethPed(MethPed_sample,prob=FALSE)
#################### Summary of results
summary(myClassification)
summary(myClassification)
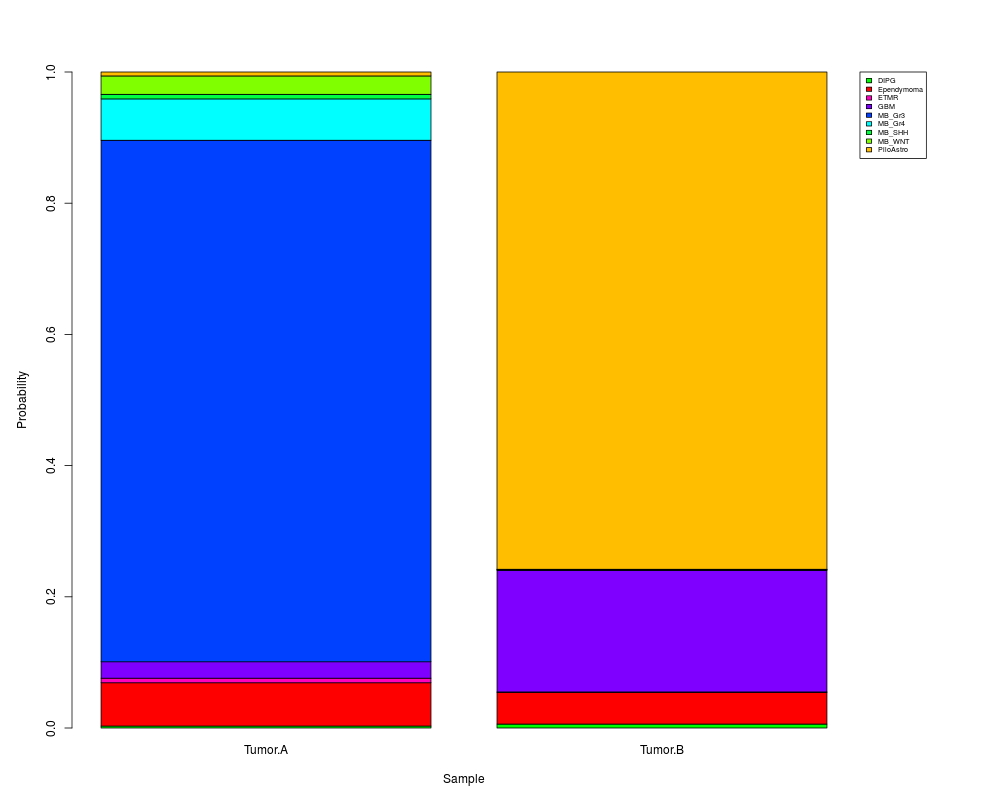
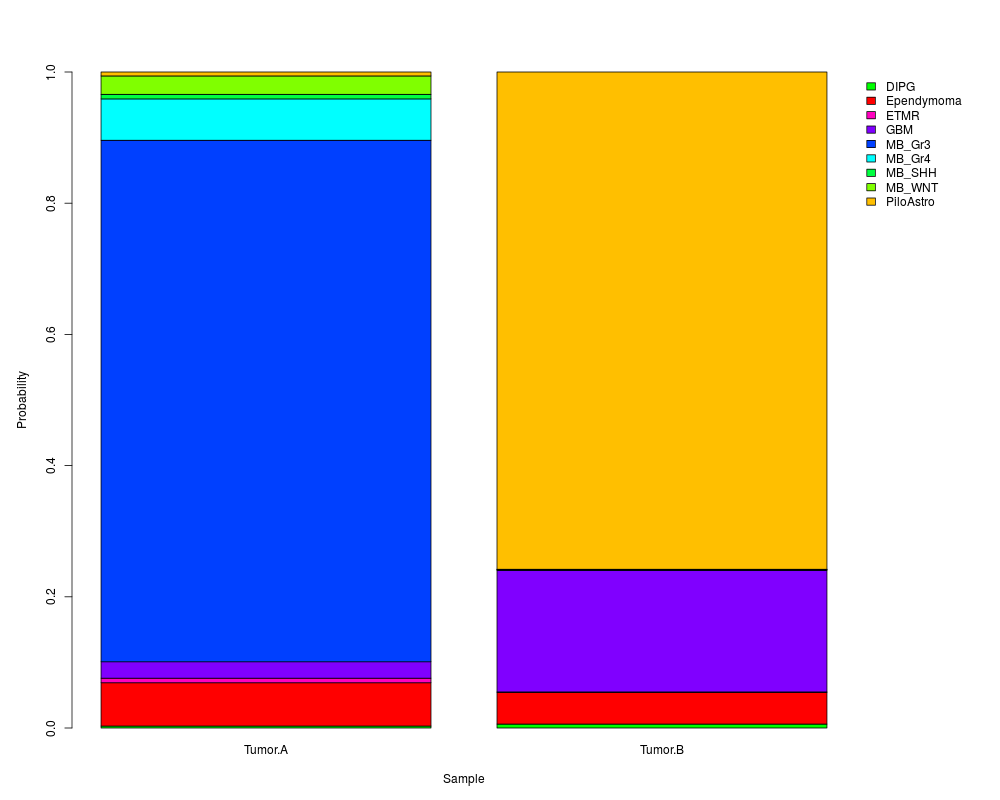
#################### Barplot of conditional prediction probability on different samples
par(mai = c(1, 1, 1, 2), xpd=TRUE)
mat<-t(myClassification$predictions)
mycols <- c("green",rainbow(nrow(mat),start=0,end=1)[nrow(mat):1],"red")
barplot(mat, col = mycols,
beside=FALSE,axisnames=TRUE,
ylim=c(0,1),xlab= "Sample",ylab="Probability")
legend( ncol(mat)+0.5,1,
legend = rownames(mat),fill = mycols,xpd=TRUE, cex = 0.6)
## Generic function to plot
plot(myClassification) # myClassification should be an object in "methPed" class
Results
R version 3.3.1 (2016-06-21) -- "Bug in Your Hair"
Copyright (C) 2016 The R Foundation for Statistical Computing
Platform: x86_64-pc-linux-gnu (64-bit)

R is free software and comes with ABSOLUTELY NO WARRANTY.
You are welcome to redistribute it under certain conditions.
Type 'license()' or 'licence()' for distribution details.

R is a collaborative project with many contributors.
Type 'contributors()' for more information and
'citation()' on how to cite R or R packages in publications.

Type 'demo()' for some demos, 'help()' for on-line help, or
'help.start()' for an HTML browser interface to help.
Type 'q()' to quit R.

> library(MethPed)
Loading required package: Biobase
Loading required package: BiocGenerics
Loading required package: parallel

Attaching package: 'BiocGenerics'

The following objects are masked from 'package:parallel':

    clusterApply, clusterApplyLB, clusterCall, clusterEvalQ,
    clusterExport, clusterMap, parApply, parCapply, parLapply,
    parLapplyLB, parRapply, parSapply, parSapplyLB

The following objects are masked from 'package:stats':

    IQR, mad, xtabs

The following objects are masked from 'package:base':

    Filter, Find, Map, Position, Reduce, anyDuplicated, append,
    as.data.frame, cbind, colnames, do.call, duplicated, eval, evalq,
    get, grep, grepl, intersect, is.unsorted, lapply, lengths, mapply,
    match, mget, order, paste, pmax, pmax.int, pmin, pmin.int, rank,
    rbind, rownames, sapply, setdiff, sort, table, tapply, union,
    unique, unsplit

Welcome to Bioconductor

    Vignettes contain introductory material; view with
    'browseVignettes()'. To cite Bioconductor, see
    'citation("Biobase")', and for packages 'citation("pkgname")'.

> png(filename="/home/ddbj/snapshot/RGM3/R_BC/result/MethPed/MethPed.Rd_%03d_medium.png", width=480, height=480)
> ### Name: MethPed
> ### Title: MethPed: a DNA methylation classifier tool for the
> ###   identification of pediatric brain tumor subtypes.
> ### Aliases: MethPed
>
> ### ** Examples
>
>
> #################### Loading and view sample data
> data(MethPed_sample)
> head(MethPed_sample,10)
ExpressionSet (storageMode: lockedEnvironment)
assayData: 1 features, 2 samples
  element names: exprs
protocolData: none
phenoData
  sampleNames: Tumor.A Tumor.B
  varLabels: Patient_ID
  varMetadata: labelDescription
featureData: none
experimentData: use 'experimentData(object)'
Annotation: IlluminaHumanMethylation450k
>
> #################### Check dimention of sample data
> dim(MethPed_sample)  # Check number pof probes and samples in data
Features  Samples
  468821        2
>
> #################### Checking missing value in the data
> missingIndex <- checkNA(MethPed_sample)
>
> #################### Apply MethPed to sample data (Probability for all tumor group)
> myClassification<-MethPed(MethPed_sample)

Probe's column name in data                 : TargetID
Probe name integrity of data with predictor : OK
Missing value in data                       : No missing data point
Data summary                                : 468821 Probes and 2 Sample


Initiating  data analysis......

Classification is being processed on 1000 tree

ntree      OOB      1      2      3      4      5      6      7      8      9
  100:   2.13% 10.71%  0.00%  0.00%  2.25%  8.11%  0.00%  0.00%  3.03%  1.72%
  200:   1.78% 10.71%  0.00%  0.00%  1.69%  8.11%  0.00%  0.00%  0.00%  1.72%
  300:   1.95% 10.71%  2.08%  0.00%  1.69%  8.11%  0.00%  0.00%  0.00%  1.72%
  400:   1.95% 10.71%  2.08%  0.00%  1.69%  8.11%  0.00%  0.00%  0.00%  1.72%
  500:   1.95% 10.71%  2.08%  0.00%  1.69%  8.11%  0.00%  0.00%  0.00%  1.72%
  600:   1.95% 10.71%  2.08%  0.00%  1.69%  8.11%  0.00%  0.00%  0.00%  1.72%
  700:   1.95% 10.71%  2.08%  0.00%  1.69%  8.11%  0.00%  0.00%  0.00%  1.72%
  800:   1.95% 10.71%  2.08%  0.00%  1.69%  8.11%  0.00%  0.00%  0.00%  1.72%
  900:   1.95% 10.71%  2.08%  0.00%  1.69%  8.11%  0.00%  0.00%  0.00%  1.72%
 1000:   1.95% 10.71%  2.08%  0.00%  1.69%  8.11%  0.00%  0.00%  0.00%  1.72%

Missing probes: 1 out of 900 probes are missing

Finished analysis data


> myClassification<-MethPed(MethPed_sample,prob=TRUE)

Probe's column name in data                 : TargetID
Probe name integrity of data with predictor : OK
Missing value in data                       : No missing data point
Data summary                                : 468821 Probes and 2 Sample


Initiating  data analysis......

Classification is being processed on 1000 tree

ntree      OOB      1      2      3      4      5      6      7      8      9
  100:   1.95%  7.14%  2.08%  0.00%  2.25%  8.11%  0.00%  0.00%  0.00%  1.72%
  200:   1.95%  7.14%  2.08%  0.00%  1.69%  8.11%  0.00%  0.00%  0.00%  3.45%
  300:   1.95%  7.14%  2.08%  0.00%  1.12%  8.11%  0.90%  0.00%  0.00%  3.45%
  400:   1.60%  7.14%  2.08%  0.00%  1.12%  8.11%  0.00%  0.00%  0.00%  1.72%
  500:   1.78%  7.14%  2.08%  0.00%  1.69%  8.11%  0.00%  0.00%  0.00%  1.72%
  600:   1.78%  7.14%  2.08%  0.00%  1.12%  8.11%  0.00%  0.00%  0.00%  3.45%
  700:   1.60%  7.14%  2.08%  0.00%  1.12%  8.11%  0.00%  0.00%  0.00%  1.72%
  800:   1.60%  7.14%  2.08%  0.00%  1.12%  8.11%  0.00%  0.00%  0.00%  1.72%
  900:   1.60%  7.14%  2.08%  0.00%  1.12%  8.11%  0.00%  0.00%  0.00%  1.72%
 1000:   1.60%  7.14%  2.08%  0.00%  1.12%  8.11%  0.00%  0.00%  0.00%  1.72%

Missing probes: 1 out of 900 probes are missing

Finished analysis data


>
> #################### Apply MethPed to sample data (Only maximum probability expected)
> myClassification_max<-MethPed(MethPed_sample,prob=FALSE)

Probe's column name in data                 : TargetID
Probe name integrity of data with predictor : OK
Missing value in data                       : No missing data point
Data summary                                : 468821 Probes and 2 Sample


Initiating  data analysis......

Classification is being processed on 1000 tree

ntree      OOB      1      2      3      4      5      6      7      8      9
  100:   2.84% 10.71%  6.25%  0.00%  1.69% 10.81%  0.90%  0.00%  0.00%  3.45%
  200:   2.13%  7.14%  4.17%  0.00%  1.12%  8.11%  0.90%  0.00%  0.00%  3.45%
  300:   1.95%  7.14%  4.17%  0.00%  1.12%  8.11%  0.90%  0.00%  0.00%  1.72%
  400:   1.78% 10.71%  2.08%  0.00%  1.12%  8.11%  0.00%  0.00%  0.00%  1.72%
  500:   1.78% 10.71%  2.08%  0.00%  1.12%  8.11%  0.00%  0.00%  0.00%  1.72%
  600:   1.78% 10.71%  2.08%  0.00%  1.12%  8.11%  0.00%  0.00%  0.00%  1.72%
  700:   1.78% 10.71%  2.08%  0.00%  1.12%  8.11%  0.00%  0.00%  0.00%  1.72%
  800:   1.60%  7.14%  2.08%  0.00%  1.12%  8.11%  0.00%  0.00%  0.00%  1.72%
  900:   1.78% 10.71%  2.08%  0.00%  1.12%  8.11%  0.00%  0.00%  0.00%  1.72%
 1000:   1.60%  7.14%  2.08%  0.00%  1.12%  8.11%  0.00%  0.00%  0.00%  1.72%

Missing probes: 1 out of 900 probes are missing

Finished analysis data


>
> #################### Summary of results
> summary(myClassification)
         DIPG Ependymoma  ETMR   GBM MB_Gr3 MB_Gr4 MB_SHH MB_WNT PiloAstro
Tumor.A 0.008      0.087 0.013 0.028  0.778  0.053  0.007  0.019     0.007
Tumor.B 0.002      0.036 0.000 0.199  0.001  0.000  0.001  0.003     0.758
> summary(myClassification)
         DIPG Ependymoma  ETMR   GBM MB_Gr3 MB_Gr4 MB_SHH MB_WNT PiloAstro
Tumor.A 0.008      0.087 0.013 0.028  0.778  0.053  0.007  0.019     0.007
Tumor.B 0.002      0.036 0.000 0.199  0.001  0.000  0.001  0.003     0.758
>
> #################### Barplot of conditional prediction probability on different samples
> par(mai = c(1, 1, 1, 2), xpd=TRUE)
> mat<-t(myClassification$predictions)
> mycols <- c("green",rainbow(nrow(mat),start=0,end=1)[nrow(mat):1],"red")
> barplot(mat,  col = mycols,
+         beside=FALSE,axisnames=TRUE,
+         ylim=c(0,1),xlab= "Sample",ylab="Probability")
> legend( ncol(mat)+0.5,1,
+        legend = rownames(mat),fill = mycols,xpd=TRUE, cex = 0.6)
>
> ## Generic function to plot
> plot(myClassification) # myClassification should be an object in "methPed" class
Error in dev.new() : no suitable unused file name for pdf()
Calls: plot -> plot.methped -> par -> resetPar -> dev.new
Execution halted
|