R: Plot conditional probability of samples that belongs to...
plot.methped
R Documentation
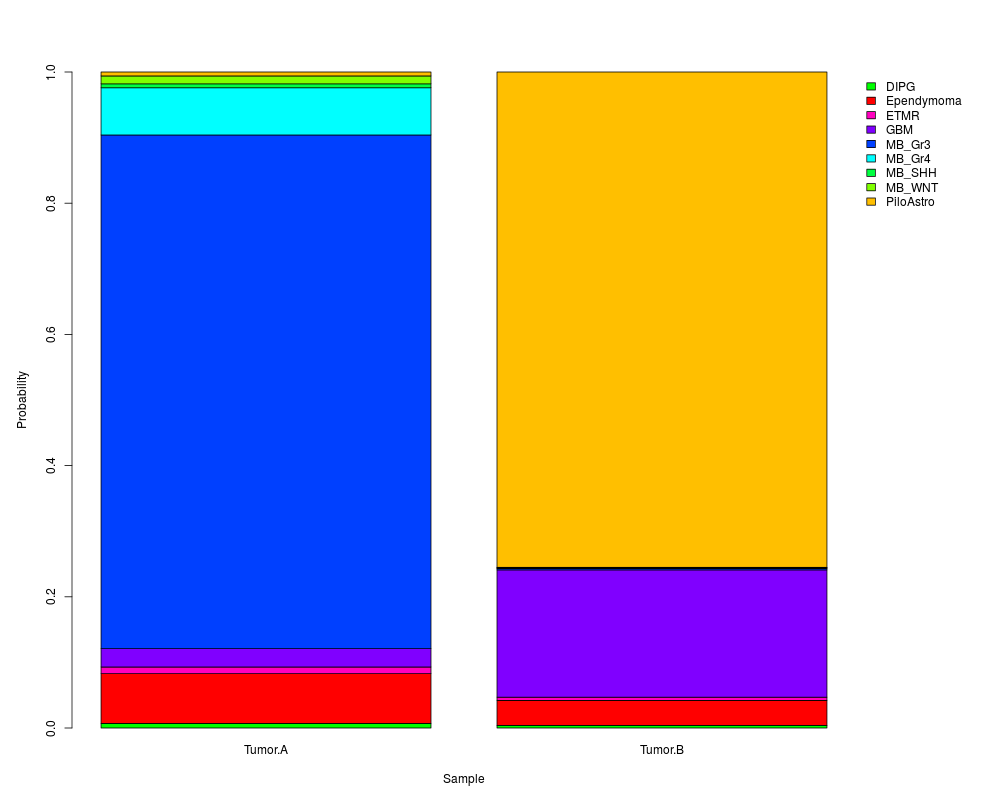
Plot conditional probability of samples that belongs to different tumor subtypes.
Description
Plot conditional probability of samples that belongs to different tumor subtypes.
Usage
## S3 method for class 'methped'
plot(x, ...)
Arguments
x
Object in "methped" class. Output of function MethPed.
...
More arguments from function barplot.
Value
Object in "methped" class. Output of function MethPed.
Examples
#################### Loading sample data
data(MethPed_sample)

#################### Applying MethPed to sample data
res<-MethPed(MethPed_sample)

#################### Plot conditional probability
plot(res)
Results
R version 3.3.1 (2016-06-21) -- "Bug in Your Hair"
Copyright (C) 2016 The R Foundation for Statistical Computing
Platform: x86_64-pc-linux-gnu (64-bit)

R is free software and comes with ABSOLUTELY NO WARRANTY.
You are welcome to redistribute it under certain conditions.
Type 'license()' or 'licence()' for distribution details.

R is a collaborative project with many contributors.
Type 'contributors()' for more information and
'citation()' on how to cite R or R packages in publications.

Type 'demo()' for some demos, 'help()' for on-line help, or
'help.start()' for an HTML browser interface to help.
Type 'q()' to quit R.

> library(MethPed)
Loading required package: Biobase
Loading required package: BiocGenerics
Loading required package: parallel

Attaching package: 'BiocGenerics'

The following objects are masked from 'package:parallel':

    clusterApply, clusterApplyLB, clusterCall, clusterEvalQ,
    clusterExport, clusterMap, parApply, parCapply, parLapply,
    parLapplyLB, parRapply, parSapply, parSapplyLB

The following objects are masked from 'package:stats':

    IQR, mad, xtabs

The following objects are masked from 'package:base':

    Filter, Find, Map, Position, Reduce, anyDuplicated, append,
    as.data.frame, cbind, colnames, do.call, duplicated, eval, evalq,
    get, grep, grepl, intersect, is.unsorted, lapply, lengths, mapply,
    match, mget, order, paste, pmax, pmax.int, pmin, pmin.int, rank,
    rbind, rownames, sapply, setdiff, sort, table, tapply, union,
    unique, unsplit

Welcome to Bioconductor

    Vignettes contain introductory material; view with
    'browseVignettes()'. To cite Bioconductor, see
    'citation("Biobase")', and for packages 'citation("pkgname")'.

> png(filename="/home/ddbj/snapshot/RGM3/R_BC/result/MethPed/plot.methped.Rd_%03d_medium.png", width=480, height=480)
> ### Name: plot.methped
> ### Title: Plot conditional probability of samples that belongs to
> ###   different tumor subtypes.
> ### Aliases: plot.methped
>
> ### ** Examples
>
>
> #################### Loading sample data
> data(MethPed_sample)
>
> #################### Applying MethPed to sample data
> res<-MethPed(MethPed_sample)

Probe's column name in data                 : TargetID
Probe name integrity of data with predictor : OK
Missing value in data                       : No missing data point
Data summary                                : 468821 Probes and 2 Sample


Initiating  data analysis......

Classification is being processed on 1000 tree

ntree      OOB      1      2      3      4      5      6      7      8      9
  100:   2.31%  7.14%  2.08%  0.00%  1.12%  8.11%  0.90%  0.00%  0.00%  6.90%
  200:   2.49% 10.71%  2.08%  0.00%  1.12% 10.81%  0.90%  0.00%  0.00%  5.17%
  300:   2.31%  7.14%  4.17%  0.00%  1.69%  8.11%  0.90%  0.00%  0.00%  3.45%
  400:   1.78%  7.14%  2.08%  0.00%  1.12%  8.11%  0.90%  0.00%  0.00%  1.72%
  500:   1.60%  7.14%  2.08%  0.00%  1.12%  8.11%  0.00%  0.00%  0.00%  1.72%
  600:   1.78%  7.14%  2.08%  0.00%  1.12%  8.11%  0.90%  0.00%  0.00%  1.72%
  700:   1.60%  7.14%  2.08%  0.00%  1.12%  8.11%  0.00%  0.00%  0.00%  1.72%
  800:   1.78% 10.71%  2.08%  0.00%  1.12%  8.11%  0.00%  0.00%  0.00%  1.72%
  900:   1.60%  7.14%  2.08%  0.00%  1.12%  8.11%  0.00%  0.00%  0.00%  1.72%
 1000:   1.78% 10.71%  2.08%  0.00%  1.12%  8.11%  0.00%  0.00%  0.00%  1.72%

Missing probes: 1 out of 900 probes are missing

Finished analysis data


>
> #################### Plot conditional probability
> plot(res)
Error in dev.new() : no suitable unused file name for pdf()
Calls: plot -> plot.methped -> par -> resetPar -> dev.new
Execution halted
 .
.