Supported by Dr. Osamu Ogasawara and  . . |
|
Last data update: 2014.03.03 |
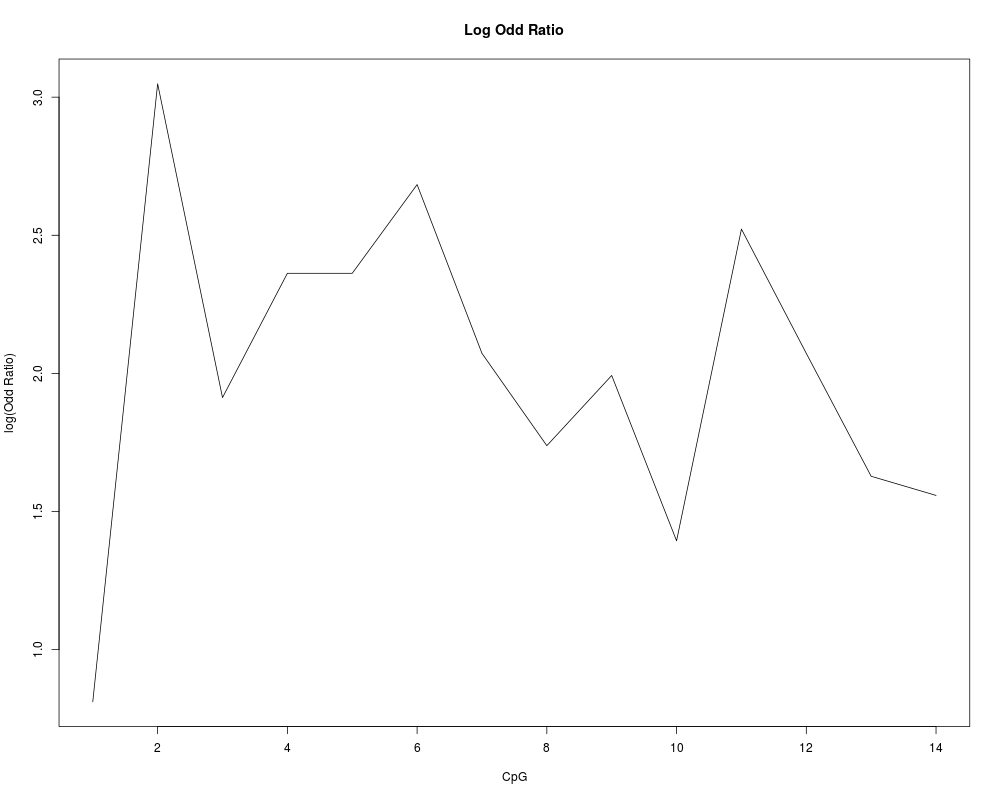
Calculate log odd ratio of the given samples (healthy/tumor)DescriptionLog Odd ratio defines the hypomethylation and hypermethylation of a sample in comparison to the other sample. Usageodd_ratio(SampA, SampB, plot = TRUE, main = "Log Odd Ratio") Arguments
ValueVector containing log odd ratios. Author(s)Muhammad Ahmer Jamil, Prof. Holger Frohlich, Priv.-Doz. Dr. Osman El-Maarri Maintainer: Muhammad Ahmer Jamil engr.ahmerjamil@gmail.com See Also
Examples
healthy = system.file("extdata", "Healthy.fasta", package = "MethTargetedNGS")
tumor = system.file("extdata", "Tumor.fasta", package = "MethTargetedNGS")
reference =  system.file("extdata", "Reference.fasta", package = "MethTargetedNGS")

healthy = methAlign(healthy,reference)
tumor = methAlign(tumor,reference)
odd_ratio(healthy,tumor)
Results
R version 3.3.1 (2016-06-21) -- "Bug in Your Hair"
Copyright (C) 2016 The R Foundation for Statistical Computing
Platform: x86_64-pc-linux-gnu (64-bit)

R is free software and comes with ABSOLUTELY NO WARRANTY.
You are welcome to redistribute it under certain conditions.
Type 'license()' or 'licence()' for distribution details.

R is a collaborative project with many contributors.
Type 'contributors()' for more information and
'citation()' on how to cite R or R packages in publications.

Type 'demo()' for some demos, 'help()' for on-line help, or
'help.start()' for an HTML browser interface to help.
Type 'q()' to quit R.

> library(MethTargetedNGS)
Loading required package: stringr
Loading required package: seqinr
Loading required package: gplots

Attaching package: 'gplots'

The following object is masked from 'package:stats':

    lowess

Loading required package: Biostrings
Loading required package: BiocGenerics
Loading required package: parallel

Attaching package: 'BiocGenerics'

The following objects are masked from 'package:parallel':

    clusterApply, clusterApplyLB, clusterCall, clusterEvalQ,
    clusterExport, clusterMap, parApply, parCapply, parLapply,
    parLapplyLB, parRapply, parSapply, parSapplyLB

The following objects are masked from 'package:stats':

    IQR, mad, xtabs

The following objects are masked from 'package:base':

    Filter, Find, Map, Position, Reduce, anyDuplicated, append,
    as.data.frame, cbind, colnames, do.call, duplicated, eval, evalq,
    get, grep, grepl, intersect, is.unsorted, lapply, lengths, mapply,
    match, mget, order, paste, pmax, pmax.int, pmin, pmin.int, rank,
    rbind, rownames, sapply, setdiff, sort, table, tapply, union,
    unique, unsplit

Loading required package: S4Vectors
Loading required package: stats4

Attaching package: 'S4Vectors'

The following object is masked from 'package:gplots':

    space

The following objects are masked from 'package:base':

    colMeans, colSums, expand.grid, rowMeans, rowSums

Loading required package: IRanges
Loading required package: XVector

Attaching package: 'Biostrings'

The following object is masked from 'package:seqinr':

    translate

> png(filename="/home/ddbj/snapshot/RGM3/R_BC/result/MethTargetedNGS/odd_ratio.Rd_%03d_medium.png", width=480, height=480)
> ### Name: odd_ratio
> ### Title: Calculate log odd ratio of the given samples (healthy/tumor)
> ### Aliases: odd_ratio
> ### Keywords: OddRatio Methylation
>
> ### ** Examples
>
> healthy = system.file("extdata", "Healthy.fasta", package = "MethTargetedNGS")
> tumor = system.file("extdata", "Tumor.fasta", package = "MethTargetedNGS")
> reference =  system.file("extdata", "Reference.fasta", package = "MethTargetedNGS")
>
> healthy = methAlign(healthy,reference)
Time difference of 1.79 secs
> tumor = methAlign(tumor,reference)
Time difference of 1.35 secs
> odd_ratio(healthy,tumor)
 [1] 0.81 3.05 1.91 2.36 2.36 2.68 2.07 1.74 1.99 1.39 2.52 2.07 1.63 1.56
>
>
>
>
>
> dev.off()
null device
          1
>
|
Created & Maintained by Osamu Ogasawara (osamu.ogasawara@gmail.com) and 