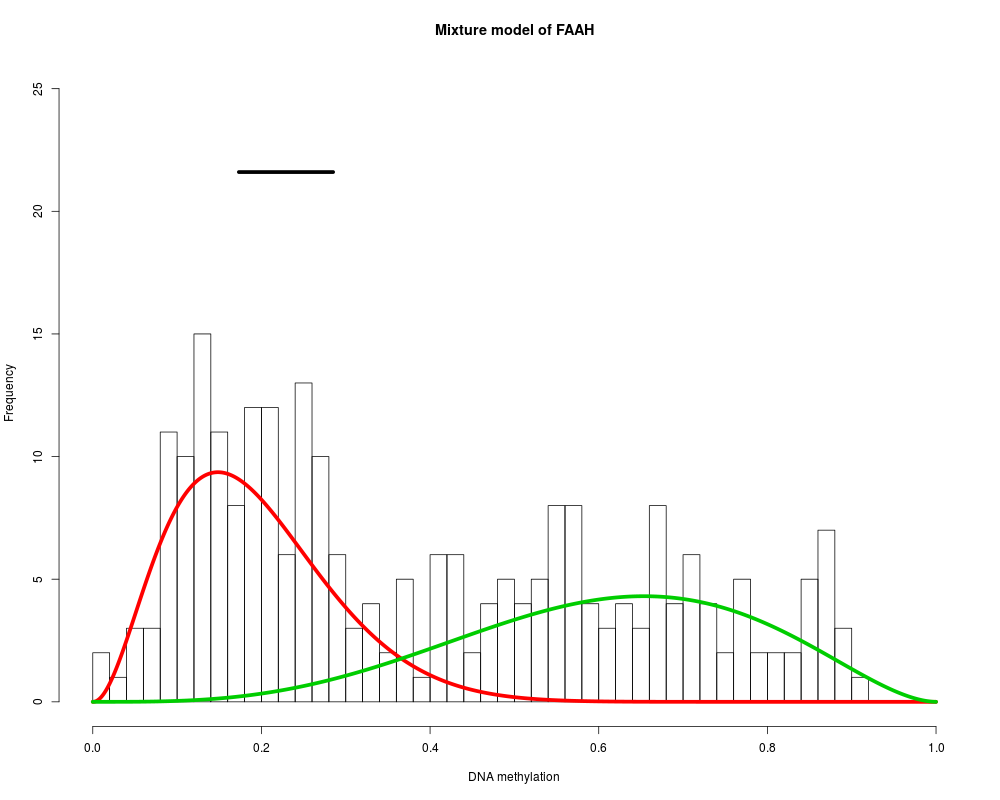
MethylMix identifies DNA methylation driven genes by modeling DNA
methylation data in cancer vs. normal and looking for homogeneous
subpopulations. In addition matched gene expression data (e.g. from
microarray technology or RNA sequencing) is used to identify functional DNA
methylation events by requiring a negative correlation between methylation
and gene expression of a particular gene.
Name of the gene for which to create a MethylMix plot.
METdata
This a matrix with the methylation data of cancer tissue
with genes in rows and samples in columns
MixtureModelResults
The results object from a MethylMix run.
METnormal
This is a matrix with the normal methylation data of the
same genes as in METcancer. Again genes in rows and samples in columns. The
samples do not have to match with the cancer data.
MAdata
This is the matched gene expression data for the same samples
as in METcancer.
FileName
Filename to export the figure. If empty figure is shown in
console.
Examples
# load the three data sets needed for MethylMix
data(METcancer)
data(METnormal)
data(MAcancer)
# run methylmix on a small set of example data
MethylMixResults=MethylMix(METcancer,METnormal,MAcancer)
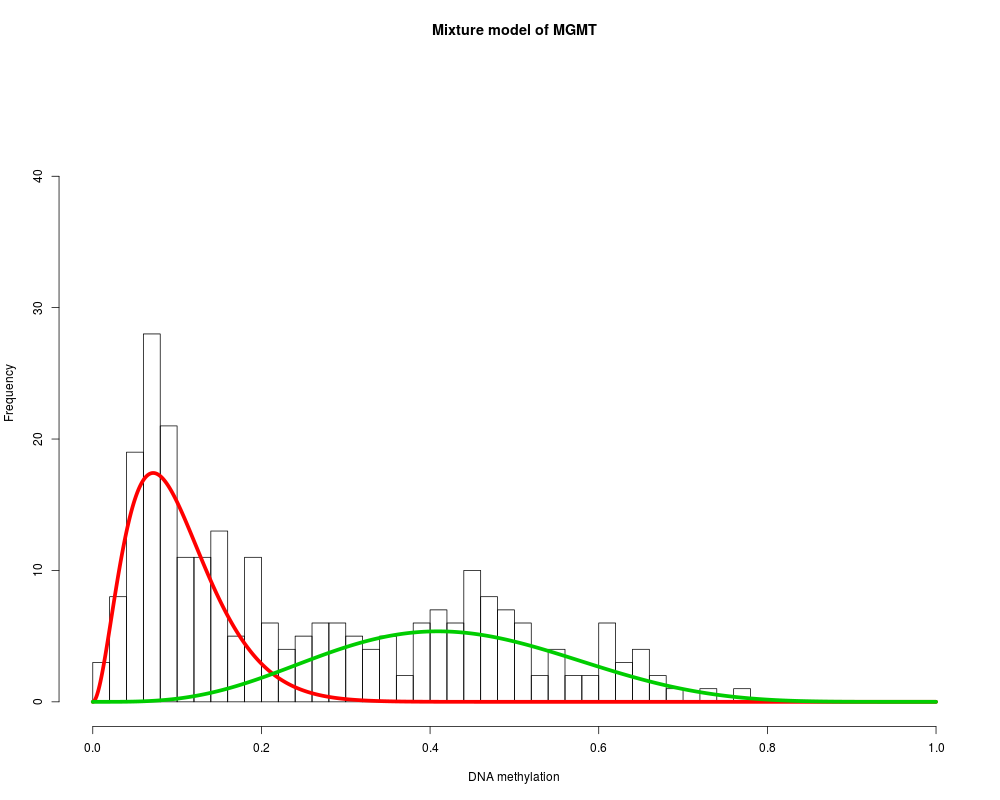
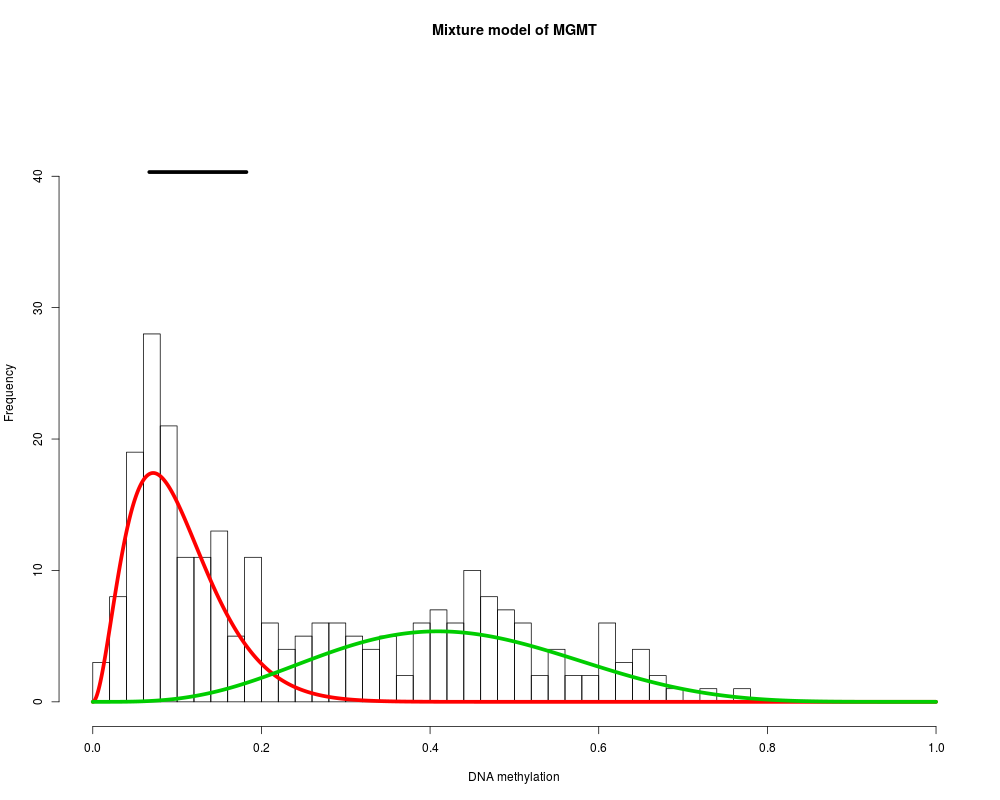
# Plot the most famous methylated gene for glioblastoma
MethylMix_PlotModel('MGMT',METcancer,MethylMixResults)
# plot MGMT also with its normal methylation variation
MethylMix_PlotModel('MGMT',METcancer,MethylMixResults,MAdata=0,METnormal)
# plot a MethylMix model for another gene
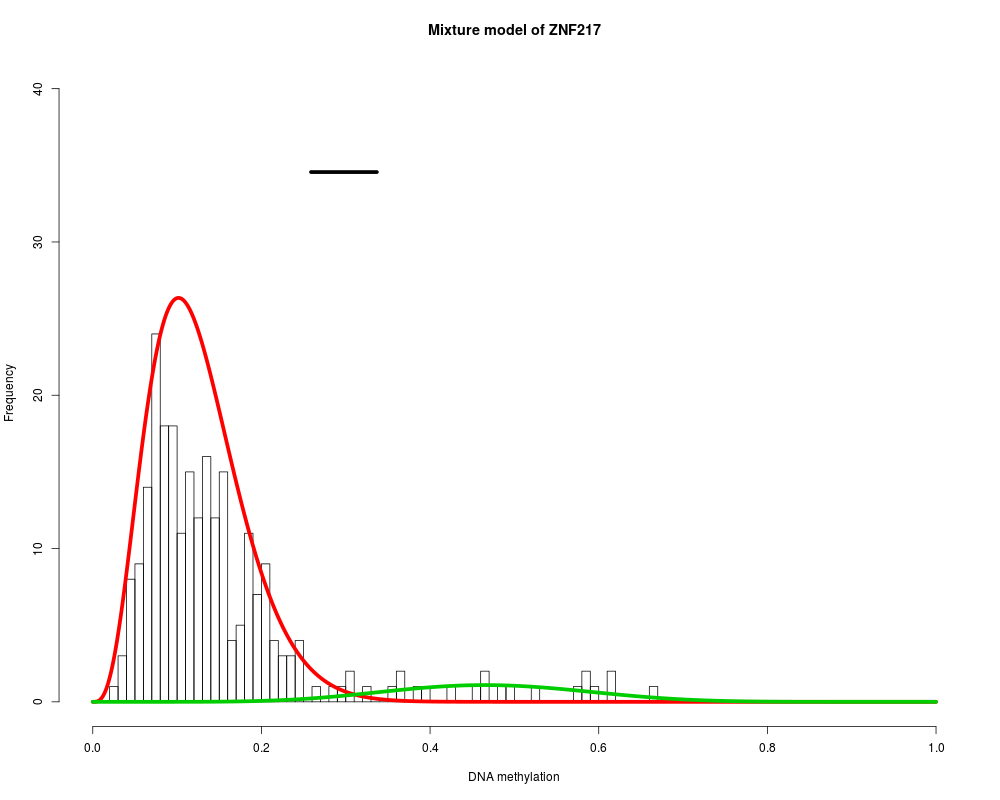
MethylMix_PlotModel('ZNF217',METcancer,MethylMixResults,MAdata=0,METnormal)
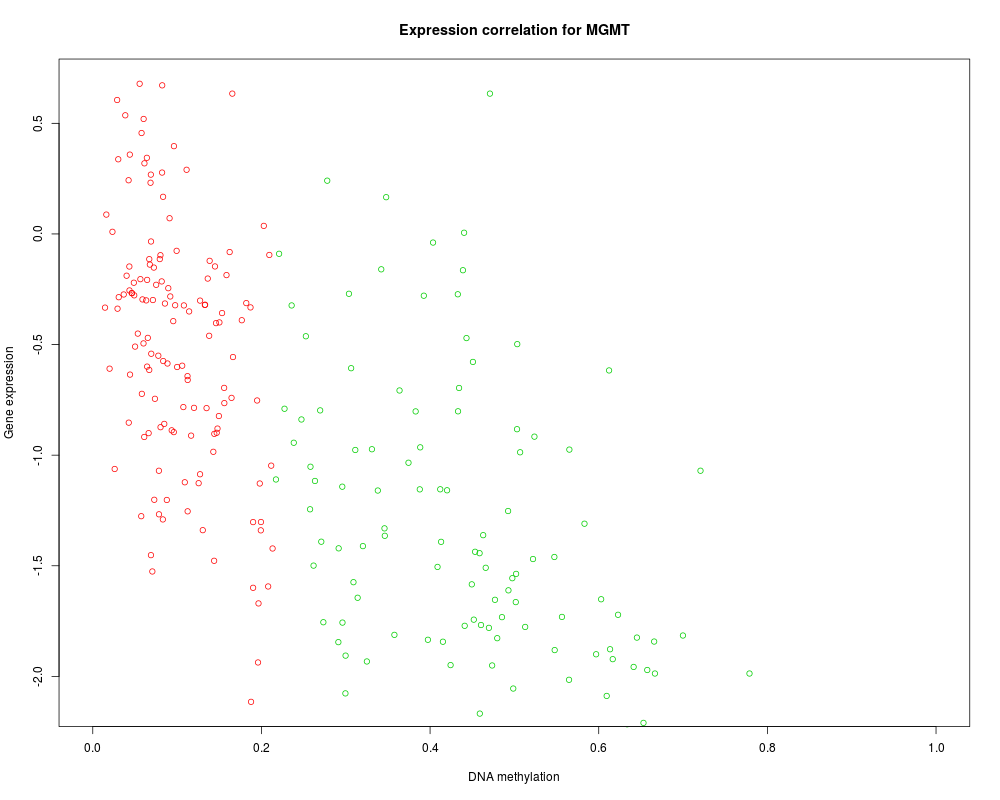
# also plot the inverse correlation with gene expression
# this creates two separate plots
MethylMix_PlotModel('MGMT',METcancer,MethylMixResults,MAdata=MAcancer)
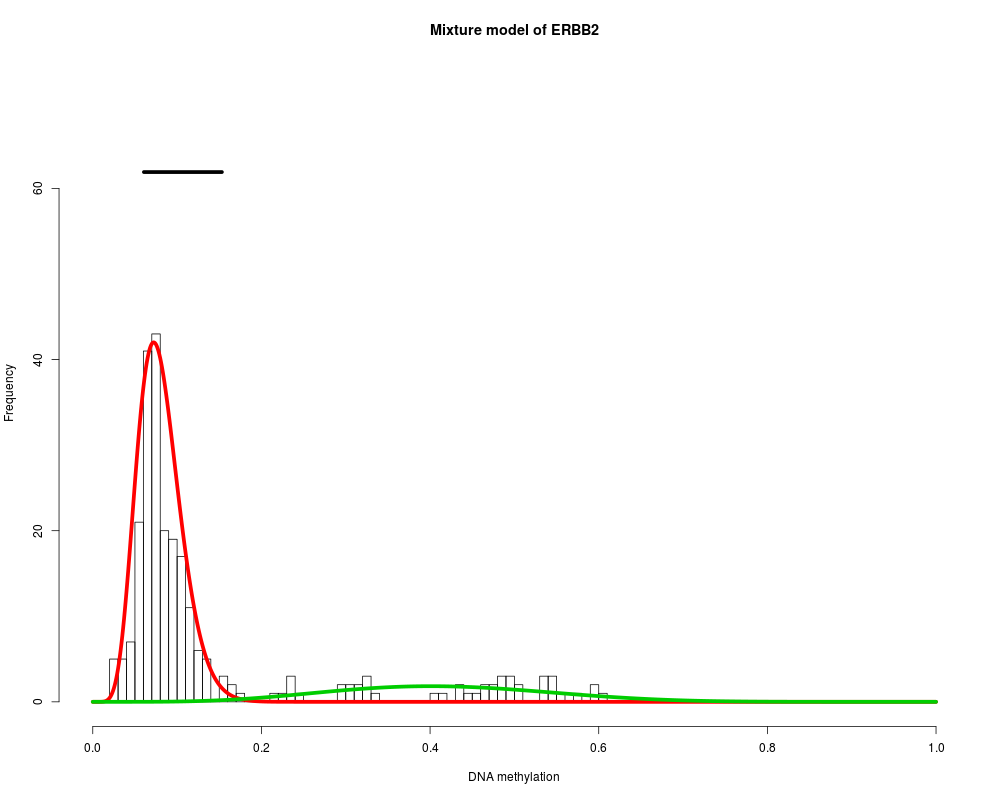
# plot all functional and differential genes
for (i in 1:length(MethylMixResults$MethylationDrivers)) {
MethylMix_PlotModel(MethylMixResults$MethylationDrivers[i],METcancer,
MethylMixResults,MAdata=0,METnormal)
}
Results
R version 3.3.1 (2016-06-21) -- "Bug in Your Hair"
Copyright (C) 2016 The R Foundation for Statistical Computing
Platform: x86_64-pc-linux-gnu (64-bit)
R is free software and comes with ABSOLUTELY NO WARRANTY.
You are welcome to redistribute it under certain conditions.
Type 'license()' or 'licence()' for distribution details.
R is a collaborative project with many contributors.
Type 'contributors()' for more information and
'citation()' on how to cite R or R packages in publications.
Type 'demo()' for some demos, 'help()' for on-line help, or
'help.start()' for an HTML browser interface to help.
Type 'q()' to quit R.
> library(MethylMix)
> png(filename="/home/ddbj/snapshot/RGM3/R_BC/result/MethylMix/MethylMix_PlotModel.Rd_%03d_medium.png", width=480, height=480)
> ### Name: MethylMix_PlotModel
> ### Title: Plotting a mixture model for a gene.
> ### Aliases: MethylMix_PlotModel
>
> ### ** Examples
>
>
> # load the three data sets needed for MethylMix
> data(METcancer)
> data(METnormal)
> data(MAcancer)
>
> # run methylmix on a small set of example data
> MethylMixResults=MethylMix(METcancer,METnormal,MAcancer)
Found 251 samples with both methylation and expression data.
Correlating methylation data with gene expression.
| | | 0% | |======== | 8% | |=============== | 15% | |======================= | 23% | |=============================== | 31% | |====================================== | 38% | |============================================== | 46% | |====================================================== | 54% | |============================================================== | 62% | |===================================================================== | 69% | |============================================================================= | 77% | |===================================================================================== | 85% | |============================================================================================ | 92% | |====================================================================================================| 100%
Found 9 functional genes.
Starting Beta mixture modeling.
Running Beta mixture model on 9 functional genes and on 251 samples.
ERBB2 : Two components are best.
FAAH : Two components are best.
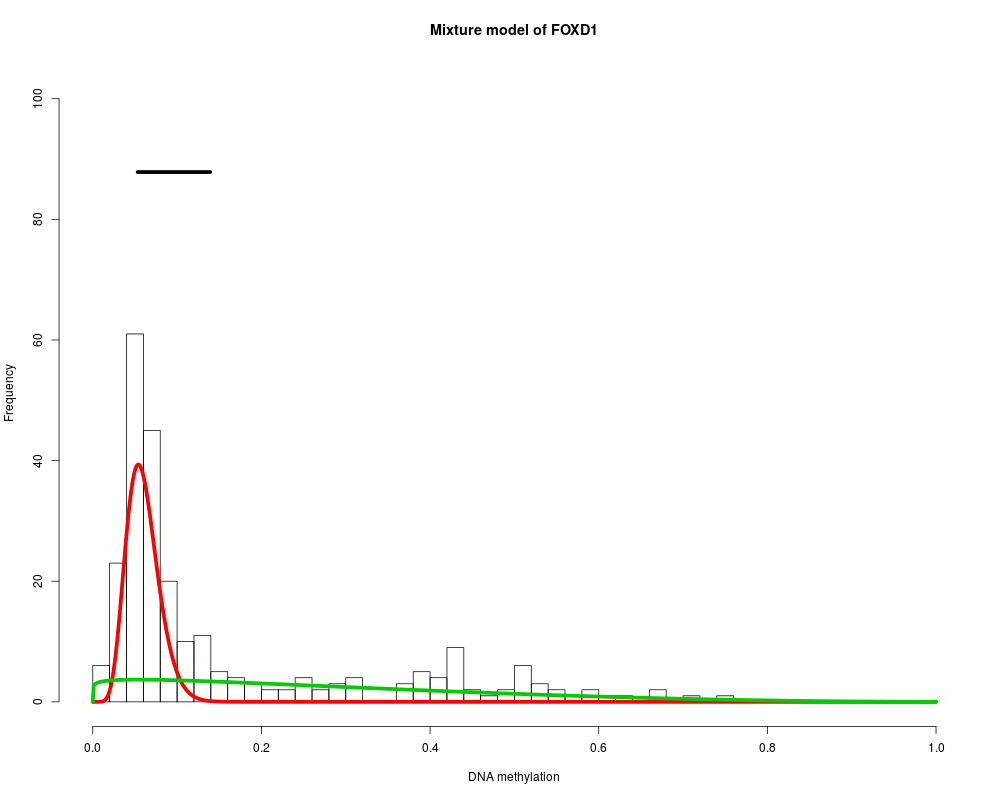
FOXD1 : Two components are best.
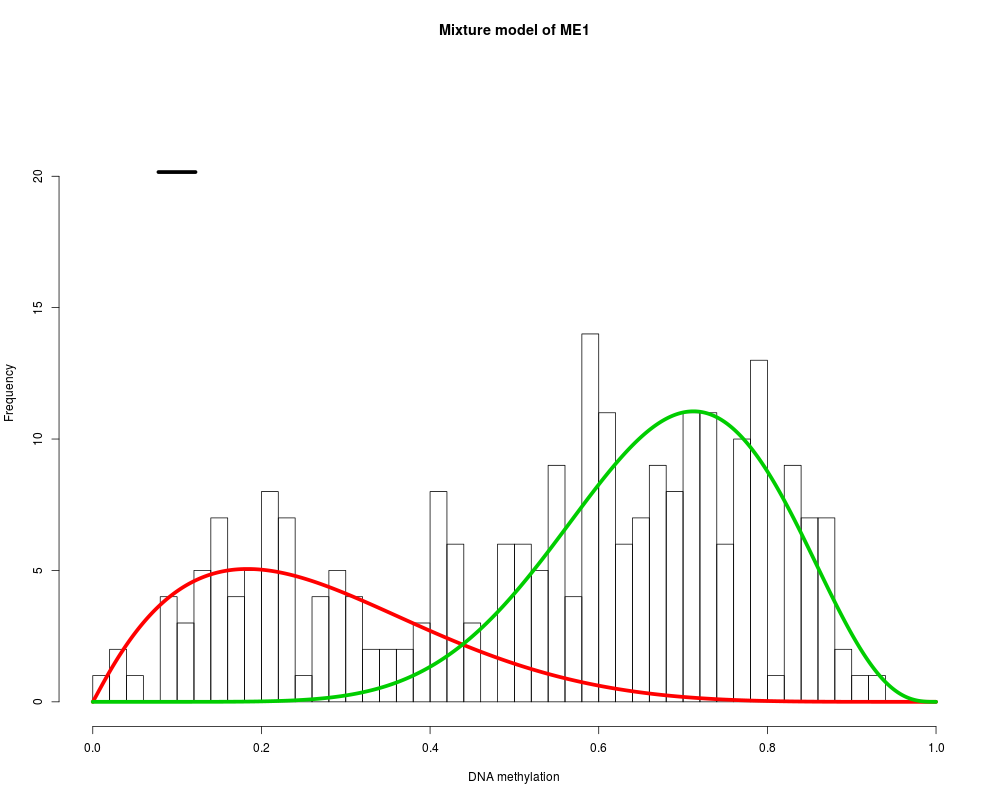
ME1 : Two components are best.
MGMT : Two components are best.
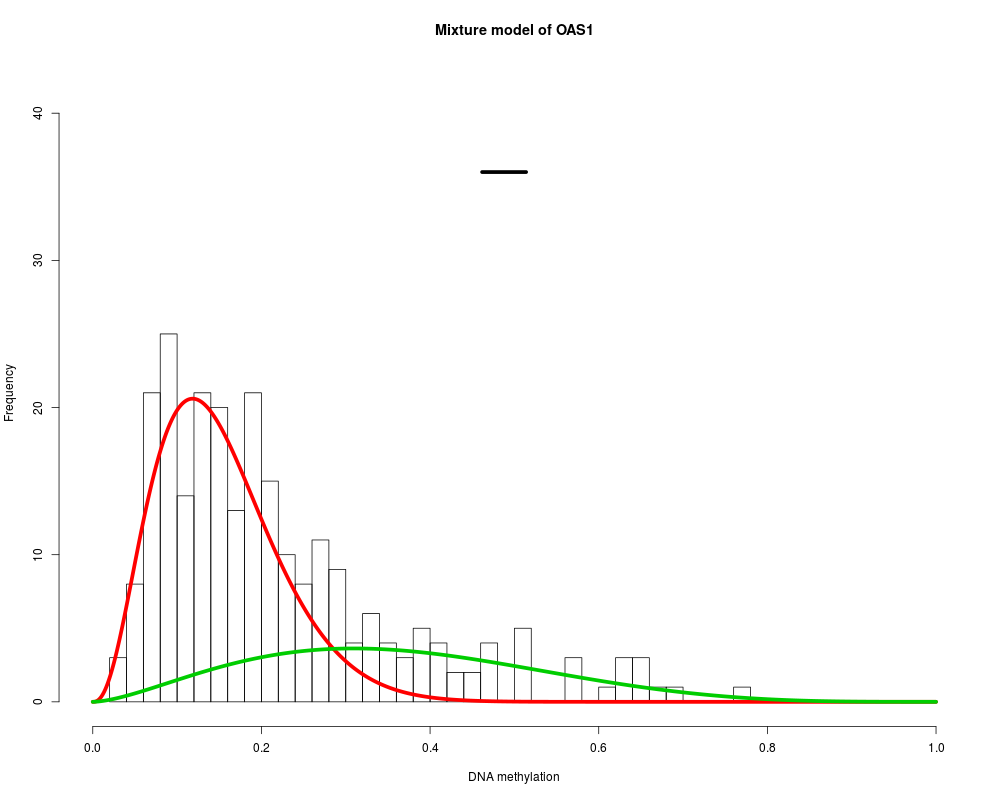
OAS1 : Two components are best.
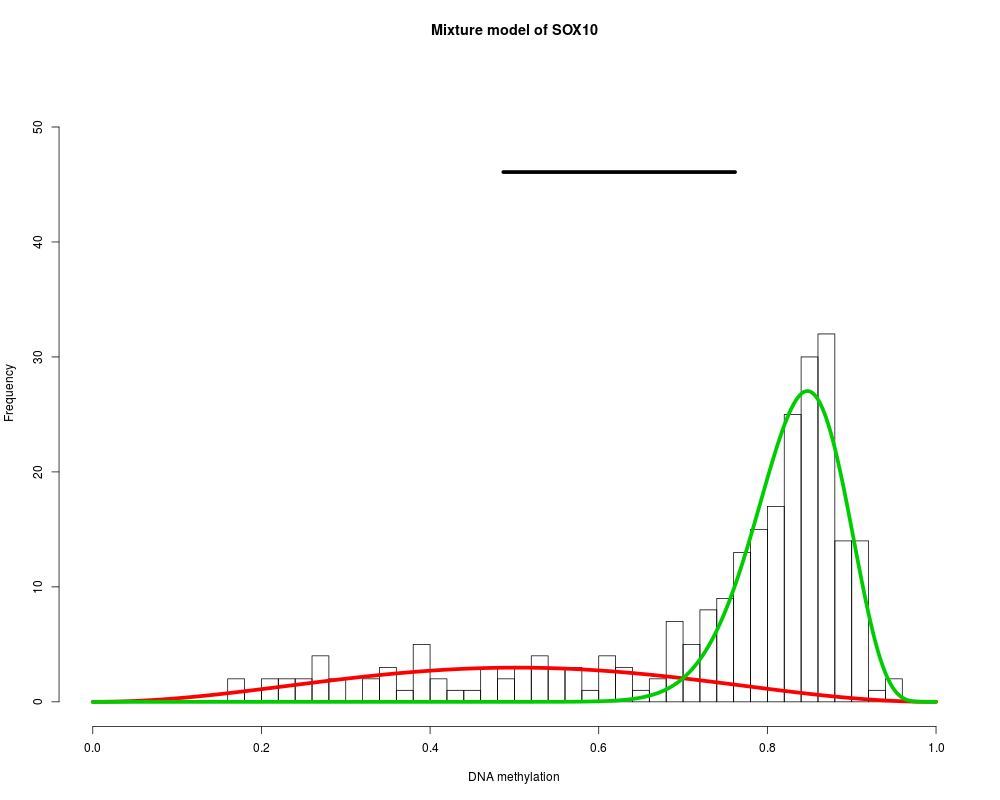
SOX10 : Two components are best.
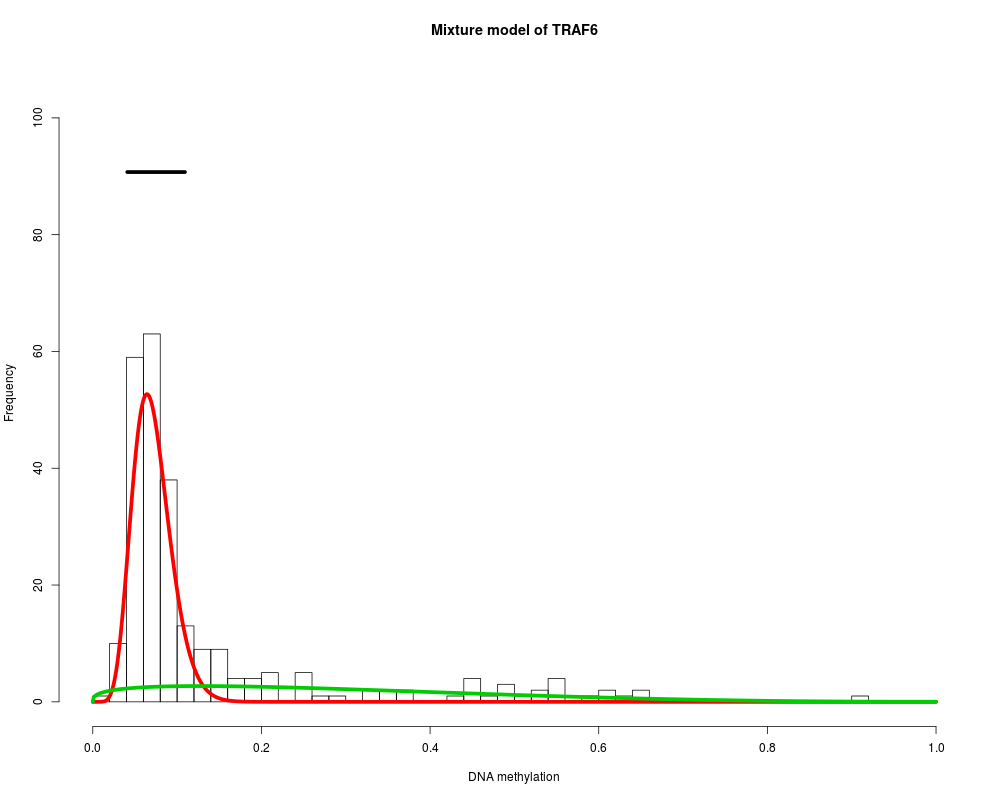
TRAF6 : Two components are best.
ZNF217 : Two components are best.
>
> # Plot the most famous methylated gene for glioblastoma
> MethylMix_PlotModel('MGMT',METcancer,MethylMixResults)
>
> # plot MGMT also with its normal methylation variation
> MethylMix_PlotModel('MGMT',METcancer,MethylMixResults,MAdata=0,METnormal)
>
> # plot a MethylMix model for another gene
> MethylMix_PlotModel('ZNF217',METcancer,MethylMixResults,MAdata=0,METnormal)
>
> # also plot the inverse correlation with gene expression
> # this creates two separate plots
> MethylMix_PlotModel('MGMT',METcancer,MethylMixResults,MAdata=MAcancer)
>
> # plot all functional and differential genes
> for (i in 1:length(MethylMixResults$MethylationDrivers)) {
+ MethylMix_PlotModel(MethylMixResults$MethylationDrivers[i],METcancer,
+ MethylMixResults,MAdata=0,METnormal)
+ }
>
>
>
>
>
> dev.off()
null device
1
>
 .
.