GRanges object containing the PMD segmentation. Return value of the
segmentPMDs function (see example).
numRegions
The number of randomly chosen regions to be plotted. The default (1)
can only be changed if a pdfFilename is provided (see below).
pdfFilename
Name of the pdf file in which the figure is saved. If no name is
provided (default), the figure is printed to the screen.
minCover
Only CpGs with a coverage of at least minCover reads will be used
for plotting.
Value
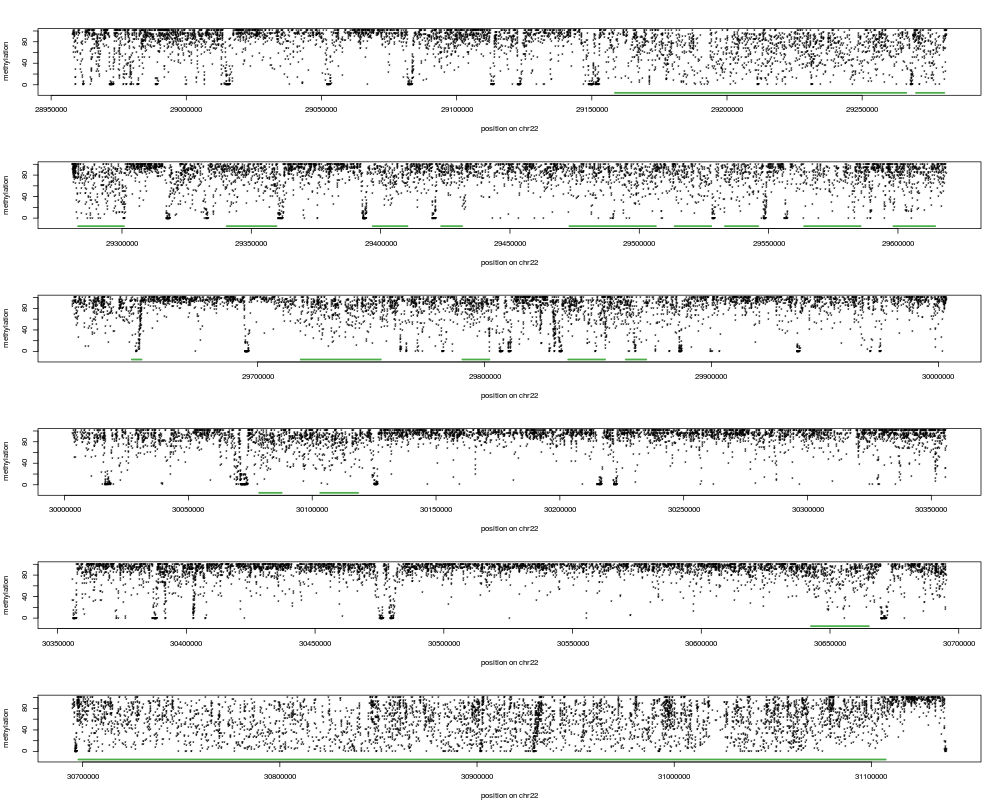
No return value. The function creates a figure showing the inferred
segmentation for a randomly chosen region. The figure is either
printed to the screen (default) or saved as a pdf if a filename is
provided. If a filename (pdfFilename) is provided, several regions
(set via the numRegions argument) can be plotted and saved in a
multi-page pdf file. The randomly chosen region that is displayed is
broken up into 6 panels and in each panel, the raw (ie unsmoothed)
methylation levels of all CpGs with a minimal coverage of 5 reads are
shown. PMDs are indicated as green bars, extending over the entire
PMD.
R version 3.3.1 (2016-06-21) -- "Bug in Your Hair"
Copyright (C) 2016 The R Foundation for Statistical Computing
Platform: x86_64-pc-linux-gnu (64-bit)
R is free software and comes with ABSOLUTELY NO WARRANTY.
You are welcome to redistribute it under certain conditions.
Type 'license()' or 'licence()' for distribution details.
R is a collaborative project with many contributors.
Type 'contributors()' for more information and
'citation()' on how to cite R or R packages in publications.
Type 'demo()' for some demos, 'help()' for on-line help, or
'help.start()' for an HTML browser interface to help.
Type 'q()' to quit R.
> library(MethylSeekR)
Loading required package: rtracklayer
Loading required package: GenomicRanges
Loading required package: BiocGenerics
Loading required package: parallel
Attaching package: 'BiocGenerics'
The following objects are masked from 'package:parallel':
clusterApply, clusterApplyLB, clusterCall, clusterEvalQ,
clusterExport, clusterMap, parApply, parCapply, parLapply,
parLapplyLB, parRapply, parSapply, parSapplyLB
The following objects are masked from 'package:stats':
IQR, mad, xtabs
The following objects are masked from 'package:base':
Filter, Find, Map, Position, Reduce, anyDuplicated, append,
as.data.frame, cbind, colnames, do.call, duplicated, eval, evalq,
get, grep, grepl, intersect, is.unsorted, lapply, lengths, mapply,
match, mget, order, paste, pmax, pmax.int, pmin, pmin.int, rank,
rbind, rownames, sapply, setdiff, sort, table, tapply, union,
unique, unsplit
Loading required package: S4Vectors
Loading required package: stats4
Attaching package: 'S4Vectors'
The following objects are masked from 'package:base':
colMeans, colSums, expand.grid, rowMeans, rowSums
Loading required package: IRanges
Loading required package: GenomeInfoDb
Loading required package: mhsmm
Loading required package: mvtnorm
> png(filename="/home/ddbj/snapshot/RGM3/R_BC/result/MethylSeekR/plotPMDSegmentation.Rd_%03d_medium.png", width=480, height=480)
> ### Name: plotPMDSegmentation
> ### Title: Plotting the PMD Segmentation
> ### Aliases: plotPMDSegmentation
>
> ### ** Examples
>
>
> library(MethylSeekR)
>
> # get chromosome lengths
> library("BSgenome.Hsapiens.UCSC.hg18")
Loading required package: BSgenome
Loading required package: Biostrings
Loading required package: XVector
> sLengths=seqlengths(Hsapiens)
>
> # read methylation data
> methFname <- system.file("extdata", "Lister2009_imr90_hg18_chr22.tab",
+ package="MethylSeekR")
> meth.gr <- readMethylome(FileName=methFname, seqLengths=sLengths)
reading methylome data
Read 200000 records
>
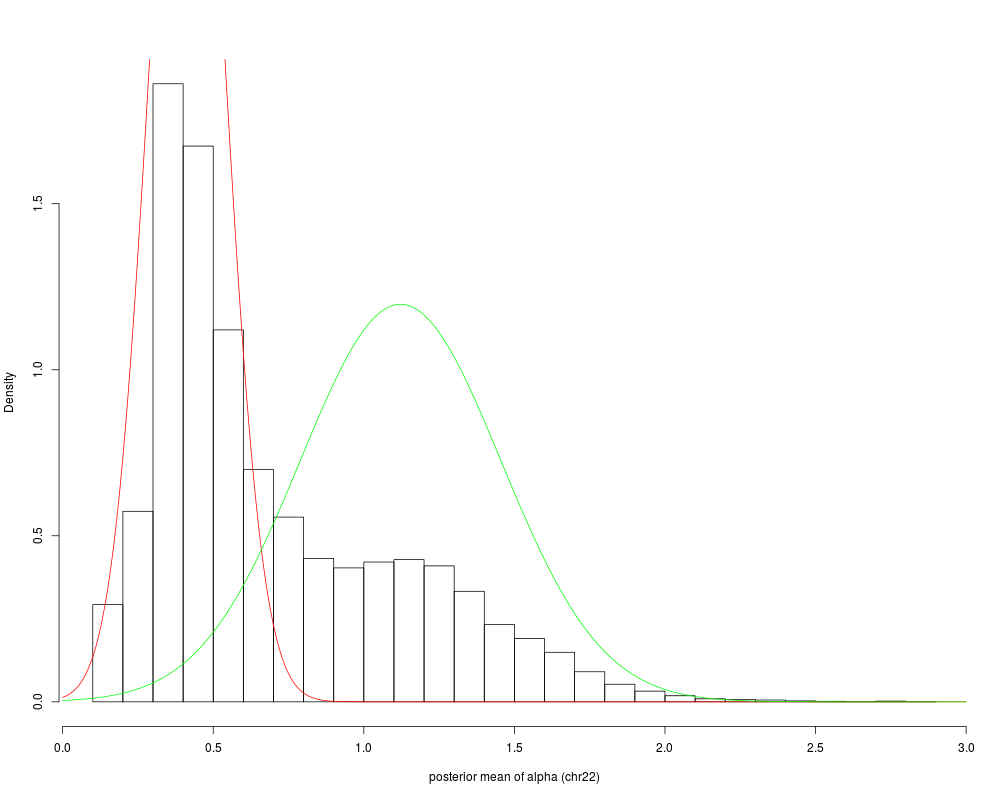
> #segment PMDs
> PMDsegments.gr <- segmentPMDs(m=meth.gr, chr.sel="chr22", seqLengths=sLengths)
training PMD-HMM on chromosome chr22
performing viterbi segmentation
creating GRanges object
>
> #plot PMD segmentation examples
> plotPMDSegmentation(m=meth.gr, segs=PMDsegments.gr, numRegions=1)
>
>
>
>
>
>
>
> dev.off()
null device
1
>
 .
.