Supported by Dr. Osamu Ogasawara and  . . |
|
Last data update: 2014.03.03 |
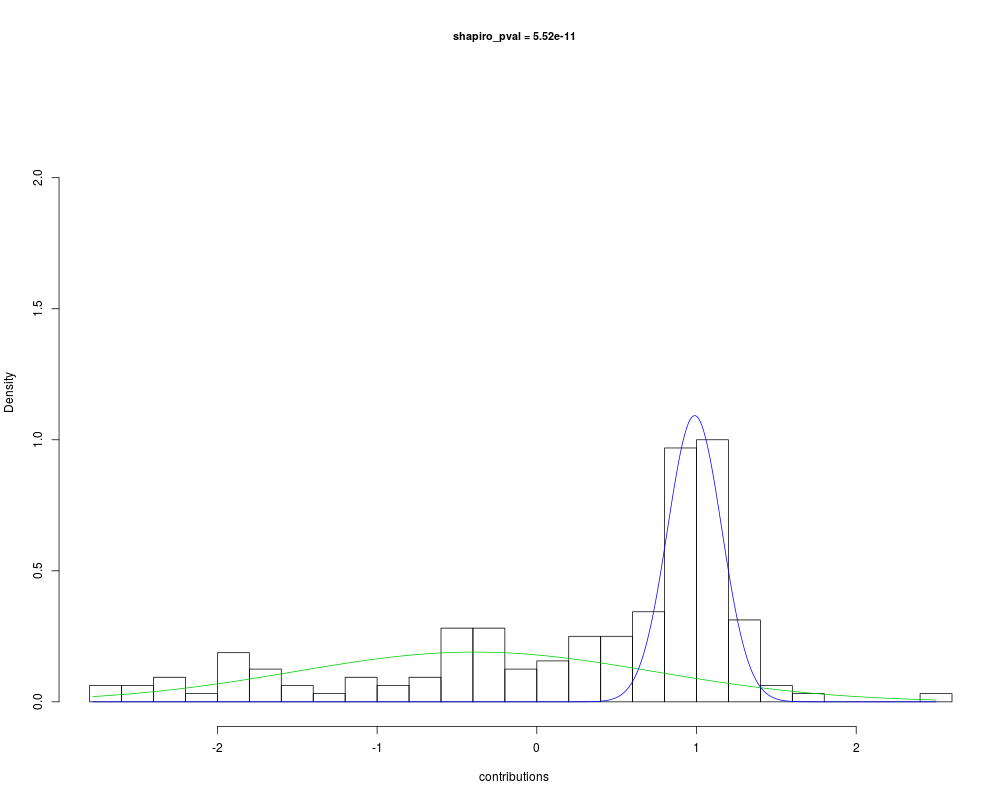
Plots an histogram and Gaussian fitted by
|
mc |
The result of Mclust function applied to
argument |
data |
A vector of numeric values |
nbBreaks |
The number of breaks for the histogram |
traceDensity |
If TRUE (default) density are displayed on the y-axis, else if FALSE counts are displayed on the y-acis |
title |
A title for the plot |
xlim |
x-axis limits to be used in the plot |
ylim |
y-axis limits to be used in the plot |
... |
additional arguments for hist |
Details
A shapiro test p-value is added to the plot title. This function can only deal with at the most three Gaussian.
Value
NULL
Author(s)
Anne Biton
See Also
hist, Mclust
Examples
## create a mix of two Gaussian
v <-c(rnorm(80,mean=-0.5,sd=1),rnorm(80,mean=1,sd=0.2))
## apply Mclust
mc <- Mclust(v)
## plot fitted Gaussian on histogram of v
plotMix(mc=mc,data=v,nbBreaks=30)
Results
R version 3.3.1 (2016-06-21) -- "Bug in Your Hair"
Copyright (C) 2016 The R Foundation for Statistical Computing
Platform: x86_64-pc-linux-gnu (64-bit)

R is free software and comes with ABSOLUTELY NO WARRANTY.
You are welcome to redistribute it under certain conditions.
Type 'license()' or 'licence()' for distribution details.

R is a collaborative project with many contributors.
Type 'contributors()' for more information and
'citation()' on how to cite R or R packages in publications.

Type 'demo()' for some demos, 'help()' for on-line help, or
'help.start()' for an HTML browser interface to help.
Type 'q()' to quit R.

> library(MineICA)
Loading required package: BiocGenerics
Loading required package: parallel

Attaching package: 'BiocGenerics'

The following objects are masked from 'package:parallel':

    clusterApply, clusterApplyLB, clusterCall, clusterEvalQ,
    clusterExport, clusterMap, parApply, parCapply, parLapply,
    parLapplyLB, parRapply, parSapply, parSapplyLB

The following objects are masked from 'package:stats':

    IQR, mad, xtabs

The following objects are masked from 'package:base':

    Filter, Find, Map, Position, Reduce, anyDuplicated, append,
    as.data.frame, cbind, colnames, do.call, duplicated, eval, evalq,
    get, grep, grepl, intersect, is.unsorted, lapply, lengths, mapply,
    match, mget, order, paste, pmax, pmax.int, pmin, pmin.int, rank,
    rbind, rownames, sapply, setdiff, sort, table, tapply, union,
    unique, unsplit

Loading required package: Biobase
Welcome to Bioconductor

    Vignettes contain introductory material; view with
    'browseVignettes()'. To cite Bioconductor, see
    'citation("Biobase")', and for packages 'citation("pkgname")'.

Loading required package: plyr
Loading required package: ggplot2
Loading required package: scales
Loading required package: foreach
Loading required package: xtable
Loading required package: biomaRt
Loading required package: gtools
Loading required package: GOstats
Loading required package: Category
Loading required package: stats4
Loading required package: AnnotationDbi
Loading required package: IRanges
Loading required package: S4Vectors

Attaching package: 'S4Vectors'

The following object is masked from 'package:plyr':

    rename

The following objects are masked from 'package:base':

    colMeans, colSums, expand.grid, rowMeans, rowSums


Attaching package: 'IRanges'

The following object is masked from 'package:plyr':

    desc

Loading required package: Matrix

Attaching package: 'Matrix'

The following object is masked from 'package:S4Vectors':

    expand

Loading required package: graph

Attaching package: 'graph'

The following object is masked from 'package:plyr':

    join


Attaching package: 'GOstats'

The following object is masked from 'package:AnnotationDbi':

    makeGOGraph

Loading required package: cluster
Loading required package: marray
Loading required package: limma

Attaching package: 'limma'

The following object is masked from 'package:BiocGenerics':

    plotMA

Loading required package: mclust
Package 'mclust' version 5.2
Type 'citation("mclust")' for citing this R package in publications.
Loading required package: RColorBrewer
Loading required package: colorspace
Loading required package: igraph

Attaching package: 'igraph'

The following objects are masked from 'package:graph':

    degree, edges, intersection, union

The following objects are masked from 'package:IRanges':

    simplify, union

The following objects are masked from 'package:S4Vectors':

    compare, union

The following object is masked from 'package:gtools':

    permute

The following objects are masked from 'package:BiocGenerics':

    normalize, union

The following objects are masked from 'package:stats':

    decompose, spectrum

The following object is masked from 'package:base':

    union

Loading required package: Rgraphviz
Loading required package: grid

Attaching package: 'Rgraphviz'

The following objects are masked from 'package:IRanges':

    from, to

The following objects are masked from 'package:S4Vectors':

    from, to

Loading required package: annotate
Loading required package: XML

Attaching package: 'XML'

The following object is masked from 'package:graph':

    addNode


Attaching package: 'annotate'

The following object is masked from 'package:Rgraphviz':

    toFile

Loading required package: Hmisc
Loading required package: lattice
Loading required package: survival
Loading required package: Formula

Attaching package: 'Hmisc'

The following object is masked from 'package:AnnotationDbi':

    contents

The following objects are masked from 'package:xtable':

    label, label<-

The following objects are masked from 'package:plyr':

    is.discrete, summarize

The following objects are masked from 'package:Biobase':

    combine, contents

The following object is masked from 'package:BiocGenerics':

    combine

The following objects are masked from 'package:base':

    format.pval, round.POSIXt, trunc.POSIXt, units

Loading required package: fastICA
Loading required package: JADE
> png(filename="/home/ddbj/snapshot/RGM3/R_BC/result/MineICA/plotMix.Rd_%03d_medium.png", width=480, height=480)
> ### Name: plotMix
> ### Title: Plots an histogram and Gaussian fitted by 'Mclust'
> ### Aliases: plotMix
>
> ### ** Examples
>
> ## create a mix of two Gaussian
> v <-c(rnorm(80,mean=-0.5,sd=1),rnorm(80,mean=1,sd=0.2))
> ## apply Mclust
> mc <- Mclust(v)
> ## plot fitted Gaussian on histogram of v
> plotMix(mc=mc,data=v,nbBreaks=30)
NULL
>
>
>
>
>
> dev.off()
null device
          1
>
|
Created & Maintained by Osamu Ogasawara (osamu.ogasawara@gmail.com) and 