Supported by Dr. Osamu Ogasawara and  . . |
|
Last data update: 2014.03.03 |
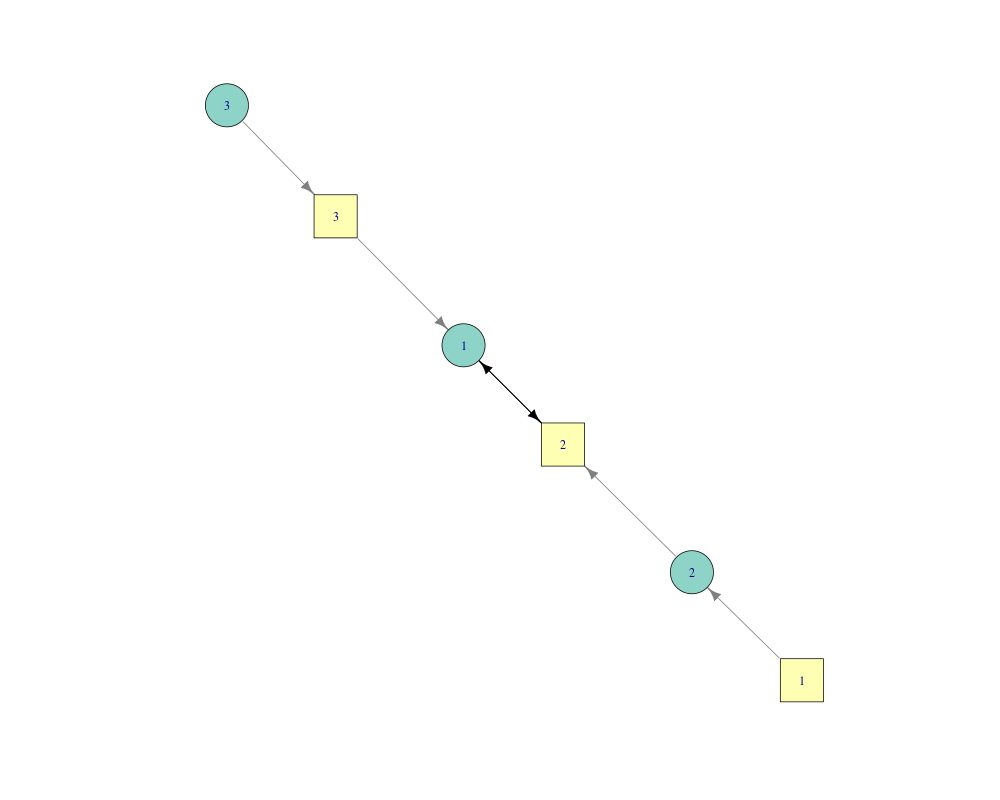
runCompareIcaSetsDescriptionThis function encompasses the comparison of several IcaSet objects using correlations and the plot of the corresponding correlation graph. The IcaSet objects are compared by calculating the correlation between either projection values of common features or genes, or contributions of common samples. Usage
  runCompareIcaSets(icaSets, labAn,
    type.corr = c("pearson", "spearman"), cutoff_zval = 0,
    level = c("genes", "features", "samples"),
    fileNodeDescr = NULL, fileDataGraph = NULL,
    plot = TRUE, title = "", col, cutoff_graph = NULL,
    useMax = TRUE, tkplot = FALSE)
Arguments
DetailsThis function calls four functions:
If the user wants to see the correlation graph in
Cytoscape, he must fill the arguments
When The user must carefully choose the data level used in the
comparison: If
When It must be taken into account by the user that if cutoff_zval is different from NULL or zero, the computation will be much slowler since each pair of component is treated individually. Edges of the graph are built based on the correlation values between the components. Absolute values of correlations are used since components have no direction. If The contents of the returned list are
ValueA list consisting of
. Author(s)Anne Biton See Also
Examples
dat1 <- data.frame(matrix(rnorm(10000),ncol=10,nrow=1000))
rownames(dat1) <- paste("g", 1:1000, sep="")
colnames(dat1) <- paste("s", 1:10, sep="")
dat2 <- data.frame(matrix(rnorm(10000),ncol=10,nrow=1000))
rownames(dat2) <- paste("g", 1:1000, sep="")
colnames(dat2) <- paste("s", 1:10, sep="")

## run ICA
resJade1 <- runICA(X=dat1, nbComp=3, method = "JADE")
resJade2 <- runICA(X=dat2, nbComp=3, method = "JADE")

## build params
params <- buildMineICAParams(resPath="toy/")

## build IcaSet objects
icaSettoy1 <- buildIcaSet(params=params, A=data.frame(resJade1$A), S=data.frame(resJade1$S),
                          dat=dat1, alreadyAnnot=TRUE)$icaSet
icaSettoy2 <- buildIcaSet(params=params, A=data.frame(resJade2$A), S=data.frame(resJade2$S),
                          dat=dat2, alreadyAnnot=TRUE)$icaSet

## compare IcaSet objects
## use tkplot=TRUE to get an interactive graph
rescomp <- runCompareIcaSets(icaSets=list(icaSettoy1, icaSettoy2), labAn=c("toy1","toy2"),
                             type.corr="pearson", level="genes", tkplot=FALSE)


## Not run:
## load the microarray-based gene expression datasets
## of breast tumors
library(breastCancerMAINZ)
library(breastCancerVDX)
data(mainz)
data(vdx)

## Define a function used to build two examples of IcaSet objects
## and annotate the probe sets into gene Symbols
treat <- function(es, annot="hgu133a.db") {
   es <- selectFeatures_IQR(es,10000)
   exprs(es) <- t(apply(exprs(es),1,scale,scale=FALSE))
   colnames(exprs(es)) <- sampleNames(es)
   resJade <- runICA(X=exprs(es), nbComp=10, method = "JADE", maxit=10000)
   resBuild <- buildIcaSet(params=buildMineICAParams(), A=data.frame(resJade$A), S=data.frame(resJade$S),
                        dat=exprs(es), pData=pData(es), refSamples=character(0),
                        annotation=annot, typeID= typeIDmainz,
                        chipManu = "affymetrix", mart=mart)
   icaSet <- resBuild$icaSet
}
## Build the two IcaSet objects
icaSetMainz <- treat(mainz)
icaSetVdx <- treat(vdx)

## compare the IcaSets
runCompareIcaSets(icaSets=list(icaSetMainz, icaSetVdx), labAn=c("Mainz","Vdx"), type.corr="pearson", level="genes")

## End(Not run)
Results
R version 3.3.1 (2016-06-21) -- "Bug in Your Hair"
Copyright (C) 2016 The R Foundation for Statistical Computing
Platform: x86_64-pc-linux-gnu (64-bit)

R is free software and comes with ABSOLUTELY NO WARRANTY.
You are welcome to redistribute it under certain conditions.
Type 'license()' or 'licence()' for distribution details.

R is a collaborative project with many contributors.
Type 'contributors()' for more information and
'citation()' on how to cite R or R packages in publications.

Type 'demo()' for some demos, 'help()' for on-line help, or
'help.start()' for an HTML browser interface to help.
Type 'q()' to quit R.

> library(MineICA)
Loading required package: BiocGenerics
Loading required package: parallel

Attaching package: 'BiocGenerics'

The following objects are masked from 'package:parallel':

    clusterApply, clusterApplyLB, clusterCall, clusterEvalQ,
    clusterExport, clusterMap, parApply, parCapply, parLapply,
    parLapplyLB, parRapply, parSapply, parSapplyLB

The following objects are masked from 'package:stats':

    IQR, mad, xtabs

The following objects are masked from 'package:base':

    Filter, Find, Map, Position, Reduce, anyDuplicated, append,
    as.data.frame, cbind, colnames, do.call, duplicated, eval, evalq,
    get, grep, grepl, intersect, is.unsorted, lapply, lengths, mapply,
    match, mget, order, paste, pmax, pmax.int, pmin, pmin.int, rank,
    rbind, rownames, sapply, setdiff, sort, table, tapply, union,
    unique, unsplit

Loading required package: Biobase
Welcome to Bioconductor

    Vignettes contain introductory material; view with
    'browseVignettes()'. To cite Bioconductor, see
    'citation("Biobase")', and for packages 'citation("pkgname")'.

Loading required package: plyr
Loading required package: ggplot2
Loading required package: scales
Loading required package: foreach
Loading required package: xtable
Loading required package: biomaRt
Loading required package: gtools
Loading required package: GOstats
Loading required package: Category
Loading required package: stats4
Loading required package: AnnotationDbi
Loading required package: IRanges
Loading required package: S4Vectors

Attaching package: 'S4Vectors'

The following object is masked from 'package:plyr':

    rename

The following objects are masked from 'package:base':

    colMeans, colSums, expand.grid, rowMeans, rowSums


Attaching package: 'IRanges'

The following object is masked from 'package:plyr':

    desc

Loading required package: Matrix

Attaching package: 'Matrix'

The following object is masked from 'package:S4Vectors':

    expand

Loading required package: graph

Attaching package: 'graph'

The following object is masked from 'package:plyr':

    join


Attaching package: 'GOstats'

The following object is masked from 'package:AnnotationDbi':

    makeGOGraph

Loading required package: cluster
Loading required package: marray
Loading required package: limma

Attaching package: 'limma'

The following object is masked from 'package:BiocGenerics':

    plotMA

Loading required package: mclust
Package 'mclust' version 5.2
Type 'citation("mclust")' for citing this R package in publications.
Loading required package: RColorBrewer
Loading required package: colorspace
Loading required package: igraph

Attaching package: 'igraph'

The following objects are masked from 'package:graph':

    degree, edges, intersection, union

The following objects are masked from 'package:IRanges':

    simplify, union

The following objects are masked from 'package:S4Vectors':

    compare, union

The following object is masked from 'package:gtools':

    permute

The following objects are masked from 'package:BiocGenerics':

    normalize, union

The following objects are masked from 'package:stats':

    decompose, spectrum

The following object is masked from 'package:base':

    union

Loading required package: Rgraphviz
Loading required package: grid

Attaching package: 'Rgraphviz'

The following objects are masked from 'package:IRanges':

    from, to

The following objects are masked from 'package:S4Vectors':

    from, to

Loading required package: annotate
Loading required package: XML

Attaching package: 'XML'

The following object is masked from 'package:graph':

    addNode


Attaching package: 'annotate'

The following object is masked from 'package:Rgraphviz':

    toFile

Loading required package: Hmisc
Loading required package: lattice
Loading required package: survival
Loading required package: Formula

Attaching package: 'Hmisc'

The following object is masked from 'package:AnnotationDbi':

    contents

The following objects are masked from 'package:xtable':

    label, label<-

The following objects are masked from 'package:plyr':

    is.discrete, summarize

The following objects are masked from 'package:Biobase':

    combine, contents

The following object is masked from 'package:BiocGenerics':

    combine

The following objects are masked from 'package:base':

    format.pval, round.POSIXt, trunc.POSIXt, units

Loading required package: fastICA
Loading required package: JADE
> png(filename="/home/ddbj/snapshot/RGM3/R_BC/result/MineICA/runCompareIcaSets.Rd_%03d_medium.png", width=480, height=480)
> ### Name: runCompareIcaSets
> ### Title: runCompareIcaSets
> ### Aliases: runCompareIcaSets
>
> ### ** Examples
>
> dat1 <- data.frame(matrix(rnorm(10000),ncol=10,nrow=1000))
> rownames(dat1) <- paste("g", 1:1000, sep="")
> colnames(dat1) <- paste("s", 1:10, sep="")
> dat2 <- data.frame(matrix(rnorm(10000),ncol=10,nrow=1000))
> rownames(dat2) <- paste("g", 1:1000, sep="")
> colnames(dat2) <- paste("s", 1:10, sep="")
>
> ## run ICA
> resJade1 <- runICA(X=dat1, nbComp=3, method = "JADE")
> resJade2 <- runICA(X=dat2, nbComp=3, method = "JADE")
>
> ## build params
> params <- buildMineICAParams(resPath="toy/")
>
> ## build IcaSet objects
> icaSettoy1 <- buildIcaSet(params=params, A=data.frame(resJade1$A), S=data.frame(resJade1$S),
+                           dat=dat1, alreadyAnnot=TRUE)$icaSet
> icaSettoy2 <- buildIcaSet(params=params, A=data.frame(resJade2$A), S=data.frame(resJade2$S),
+                           dat=dat2, alreadyAnnot=TRUE)$icaSet
>
> ## compare IcaSet objects
> ## use tkplot=TRUE to get an interactive graph
> rescomp <- runCompareIcaSets(icaSets=list(icaSettoy1, icaSettoy2), labAn=c("toy1","toy2"),
+                              type.corr="pearson", level="genes", tkplot=FALSE)
Warning messages:
1: In brewer.pal(nbAn, "Set3") :
  minimal value for n is 3, returning requested palette with 3 different levels

2: In layout_with_fr(list(6, TRUE, c(0, 1, 2, 3, 4, 5), c(3, 3, 4,  :
  Argument `area' is deprecated and has no effect
3: In layout_with_fr(list(6, TRUE, c(0, 1, 2, 3, 4, 5), c(3, 3, 4,  :
  Argument `repulserad' is deprecated and has no effect
>
>
> ## Not run:
> ##D ## load the microarray-based gene expression datasets
> ##D ## of breast tumors
> ##D library(breastCancerMAINZ)
> ##D library(breastCancerVDX)
> ##D data(mainz)
> ##D data(vdx)
> ##D
> ##D ## Define a function used to build two examples of IcaSet objects
> ##D ## and annotate the probe sets into gene Symbols
> ##D treat <- function(es, annot="hgu133a.db") {
> ##D    es <- selectFeatures_IQR(es,10000)
> ##D    exprs(es) <- t(apply(exprs(es),1,scale,scale=FALSE))
> ##D    colnames(exprs(es)) <- sampleNames(es)
> ##D    resJade <- runICA(X=exprs(es), nbComp=10, method = "JADE", maxit=10000)
> ##D    resBuild <- buildIcaSet(params=buildMineICAParams(), A=data.frame(resJade$A), S=data.frame(resJade$S),
> ##D                         dat=exprs(es), pData=pData(es), refSamples=character(0),
> ##D                         annotation=annot, typeID= typeIDmainz,
> ##D                         chipManu = "affymetrix", mart=mart)
> ##D    icaSet <- resBuild$icaSet
> ##D }
> ##D ## Build the two IcaSet objects
> ##D icaSetMainz <- treat(mainz)
> ##D icaSetVdx <- treat(vdx)
> ##D
> ##D ## compare the IcaSets
> ##D runCompareIcaSets(icaSets=list(icaSetMainz, icaSetVdx), labAn=c("Mainz","Vdx"), type.corr="pearson", level="genes")
> ## End(Not run)
>
>
>
>
>
> dev.off()
null device
          1
>
|