|
Last data update: 2014.03.03
|
R: Plot the log R ratios and BAFs on a grid given by precomputed...
| pedigreeGrid | R Documentation |
Plot the log R ratios and BAFs on a grid given by precomputed viewports
Description
Plot the log R ratios and BAFs on a grid given by precomputed viewports
Usage
pedigreeGrid(g, vps, figs)
Arguments
g |
a MDRanges object
|
vps |
a list of viewports. See pedigreeViewports.
|
figs |
a list of trellis objects created by the function plotDenovo.
|
See Also
plotDenovo pedigreeViewports
Examples
library(VanillaICE)
require(grid)
##marker-level summaries
data(md_exp)
seqlevels(md_exp, force=TRUE) <- "chr22"
## segmentation results
data(md_gr)
posteriorCalls <- MAP2(md_exp, md_gr, MinDistParam())
g <- denovoHemizygous(posteriorCalls)
g
vps <- MinimumDistance:::pedigreeViewports()
param <- HmmTrellisParam()
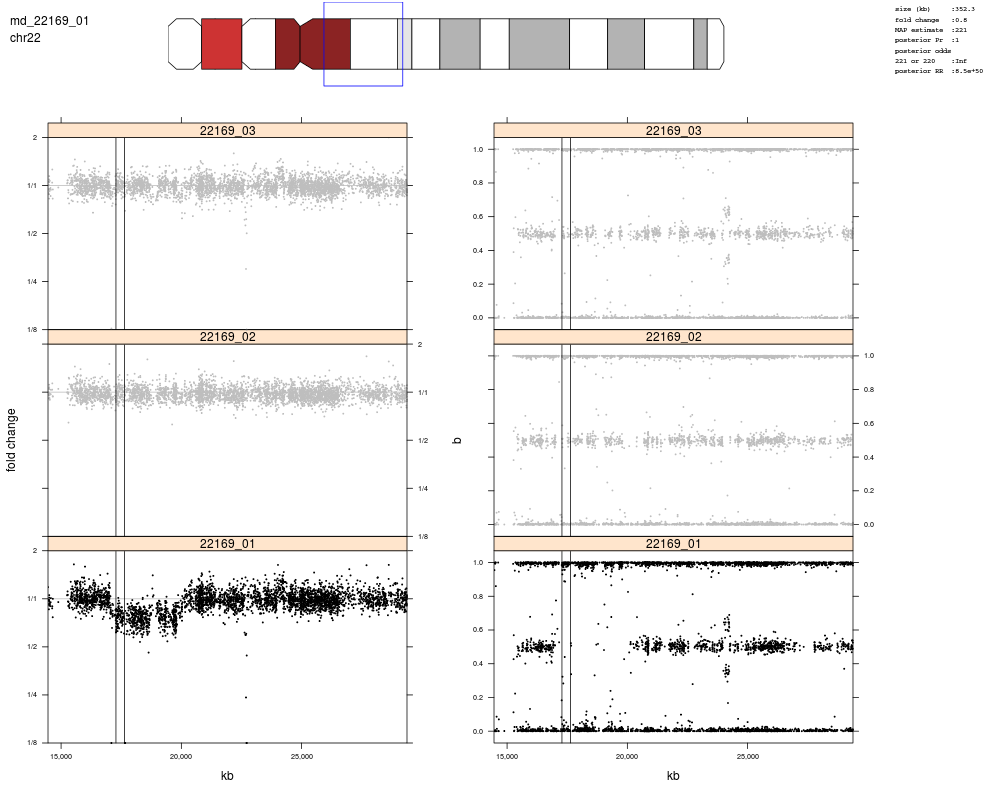
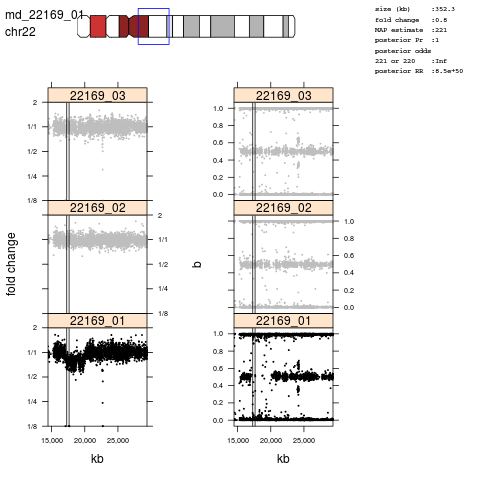
p <- plotDenovo(md_exp, g[1], param)
p <- pedigreeGrid(g=g[1], vps=vps, figs=p)
leg <- mdLegend(g[1])
upViewport(0)
pushViewport(vps[["legend"]])
grid.text(leg, x=unit(0.02, "npc"), y=unit(0.95, "npc"), just=c("left", "top"),
gp=gpar(cex=0.6, fontfamily="mono"))
##
## combine adjacent denovo hemizygous
##
g2 <- reduce(denovoHemizygous(posteriorCalls), min.gapwidth=500e3)
post <- MAP2(md_exp, g2)
g2 <- denovoHemizygous(post)
p <- plotDenovo(md_exp, g2, param)
p <- pedigreeGrid(g=g2, vps=vps, figs=p)
leg <- mdLegend(g2)
upViewport(0)
pushViewport(vps[["legend"]])
grid.text(leg, x=unit(0.02, "npc"), y=unit(0.95, "npc"), just=c("left", "top"),
gp=gpar(cex=0.6, fontfamily="mono"))
Results
R version 3.3.1 (2016-06-21) -- "Bug in Your Hair"
Copyright (C) 2016 The R Foundation for Statistical Computing
Platform: x86_64-pc-linux-gnu (64-bit)
R is free software and comes with ABSOLUTELY NO WARRANTY.
You are welcome to redistribute it under certain conditions.
Type 'license()' or 'licence()' for distribution details.
R is a collaborative project with many contributors.
Type 'contributors()' for more information and
'citation()' on how to cite R or R packages in publications.
Type 'demo()' for some demos, 'help()' for on-line help, or
'help.start()' for an HTML browser interface to help.
Type 'q()' to quit R.
> library(MinimumDistance)
Loading required package: VanillaICE
Loading required package: BiocGenerics
Loading required package: parallel
Attaching package: 'BiocGenerics'
The following objects are masked from 'package:parallel':
clusterApply, clusterApplyLB, clusterCall, clusterEvalQ,
clusterExport, clusterMap, parApply, parCapply, parLapply,
parLapplyLB, parRapply, parSapply, parSapplyLB
The following objects are masked from 'package:stats':
IQR, mad, xtabs
The following objects are masked from 'package:base':
Filter, Find, Map, Position, Reduce, anyDuplicated, append,
as.data.frame, cbind, colnames, do.call, duplicated, eval, evalq,
get, grep, grepl, intersect, is.unsorted, lapply, lengths, mapply,
match, mget, order, paste, pmax, pmax.int, pmin, pmin.int, rank,
rbind, rownames, sapply, setdiff, sort, table, tapply, union,
unique, unsplit
Loading required package: GenomicRanges
Loading required package: S4Vectors
Loading required package: stats4
Attaching package: 'S4Vectors'
The following objects are masked from 'package:base':
colMeans, colSums, expand.grid, rowMeans, rowSums
Loading required package: IRanges
Loading required package: GenomeInfoDb
Loading required package: SummarizedExperiment
Loading required package: Biobase
Welcome to Bioconductor
Vignettes contain introductory material; view with
'browseVignettes()'. To cite Bioconductor, see
'citation("Biobase")', and for packages 'citation("pkgname")'.
Welcome to VanillaICE version 1.34.0
Welcome to MinimumDistance version 1.16.0
Attaching package: 'MinimumDistance'
The following object is masked from 'package:VanillaICE':
acf2
> png(filename="/home/ddbj/snapshot/RGM3/R_BC/result/MinimumDistance/pedigreeGrid.Rd_%03d_medium.png", width=480, height=480)
> ### Name: pedigreeGrid
> ### Title: Plot the log R ratios and BAFs on a grid given by precomputed
> ### viewports
> ### Aliases: pedigreeGrid
>
> ### ** Examples
>
> library(VanillaICE)
> require(grid)
Loading required package: grid
> ##marker-level summaries
> data(md_exp)
> seqlevels(md_exp, force=TRUE) <- "chr22"
> ## segmentation results
> data(md_gr)
> posteriorCalls <- MAP2(md_exp, md_gr, MinDistParam())
> g <- denovoHemizygous(posteriorCalls)
> g
MDRanges object with 3 ranges and 9 metadata columns:
seqnames ranges strand | sample seg.mean log_RR
<Rle> <IRanges> <Rle> | <character> <numeric> <numeric>
[1] chr22 [17281004, 17633332] * | md_22169_01 -0.3175 117.288
[2] chr22 [17670969, 18670691] * | md_22169_01 -0.3538 566.107
[3] chr22 [19066315, 19792353] * | md_22169_01 -0.3335 343.433
log_odds prob_MAP prob_222 prob_221 calls number_probes
<numeric> <numeric> <numeric> <numeric> <character> <integer>
[1] Inf 1 0 1 221 88
[2] Inf 1 0 1 221 278
[3] Inf 1 0 1 221 208
-------
seqinfo: 1 sequence from hg18 genome
> vps <- MinimumDistance:::pedigreeViewports()
> param <- HmmTrellisParam()
> p <- plotDenovo(md_exp, g[1], param)
> p <- pedigreeGrid(g=g[1], vps=vps, figs=p)
> leg <- mdLegend(g[1])
> upViewport(0)
> pushViewport(vps[["legend"]])
> grid.text(leg, x=unit(0.02, "npc"), y=unit(0.95, "npc"), just=c("left", "top"),
+ gp=gpar(cex=0.6, fontfamily="mono"))
> ##
> ## combine adjacent denovo hemizygous
> ##
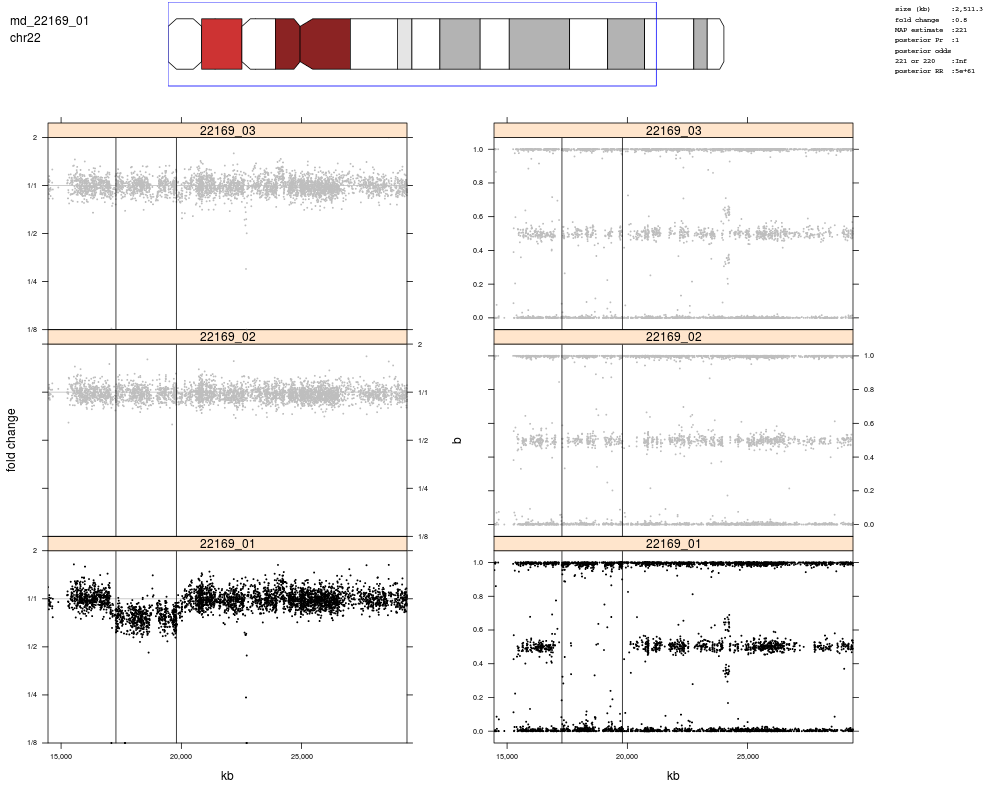
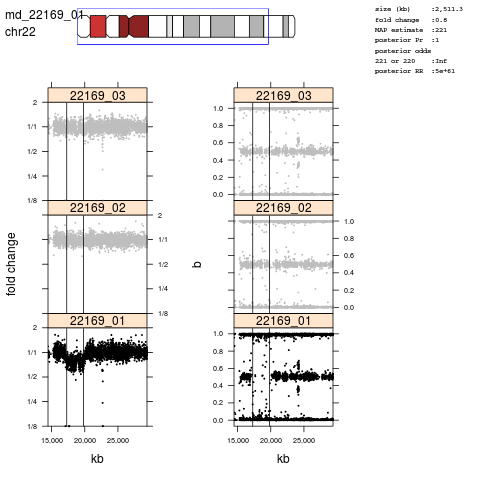
> g2 <- reduce(denovoHemizygous(posteriorCalls), min.gapwidth=500e3)
> post <- MAP2(md_exp, g2)
> g2 <- denovoHemizygous(post)
> p <- plotDenovo(md_exp, g2, param)
> p <- pedigreeGrid(g=g2, vps=vps, figs=p)
> leg <- mdLegend(g2)
> upViewport(0)
> pushViewport(vps[["legend"]])
> grid.text(leg, x=unit(0.02, "npc"), y=unit(0.95, "npc"), just=c("left", "top"),
+ gp=gpar(cex=0.6, fontfamily="mono"))
>
>
>
>
>
> dev.off()
null device
1
>
|
|
 .
.