R version 3.3.1 (2016-06-21) -- "Bug in Your Hair"
Copyright (C) 2016 The R Foundation for Statistical Computing
Platform: x86_64-pc-linux-gnu (64-bit)
R is free software and comes with ABSOLUTELY NO WARRANTY.
You are welcome to redistribute it under certain conditions.
Type 'license()' or 'licence()' for distribution details.
R is a collaborative project with many contributors.
Type 'contributors()' for more information and
'citation()' on how to cite R or R packages in publications.
Type 'demo()' for some demos, 'help()' for on-line help, or
'help.start()' for an HTML browser interface to help.
Type 'q()' to quit R.
> library(Mirsynergy)
Loading required package: igraph
Attaching package: 'igraph'
The following objects are masked from 'package:stats':
decompose, spectrum
The following object is masked from 'package:base':
union
Loading required package: ggplot2
> png(filename="/home/ddbj/snapshot/RGM3/R_BC/result/Mirsynergy/plot_module_summary.Rd_%03d_medium.png", width=480, height=480)
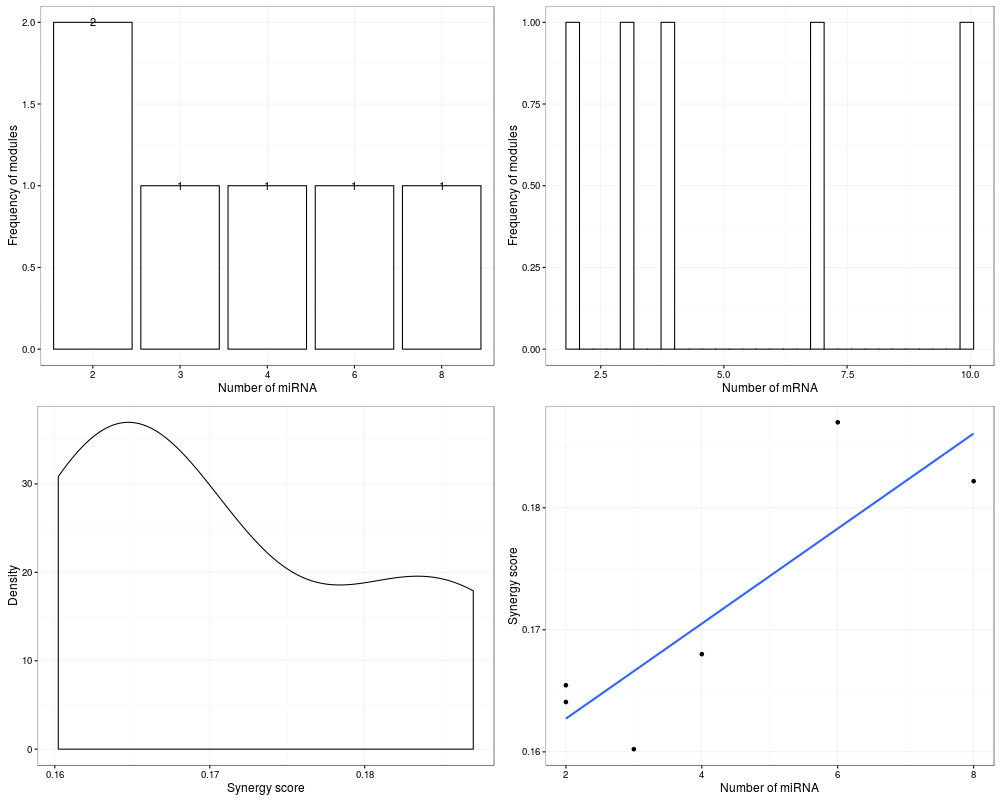
> ### Name: plot_module_summary
> ### Title: Plot module statistics
> ### Aliases: plot_module_summary
>
> ### ** Examples
>
> load(system.file("extdata/toy_modules.RData", package="Mirsynergy"))
>
> plot_module_summary(V)
`stat_bin()` using `bins = 30`. Pick better value with `binwidth`.
>
>
>
>
>
> dev.off()
null device
1
>
 .
.