Supported by Dr. Osamu Ogasawara and  . . |
|
Last data update: 2014.03.03 |
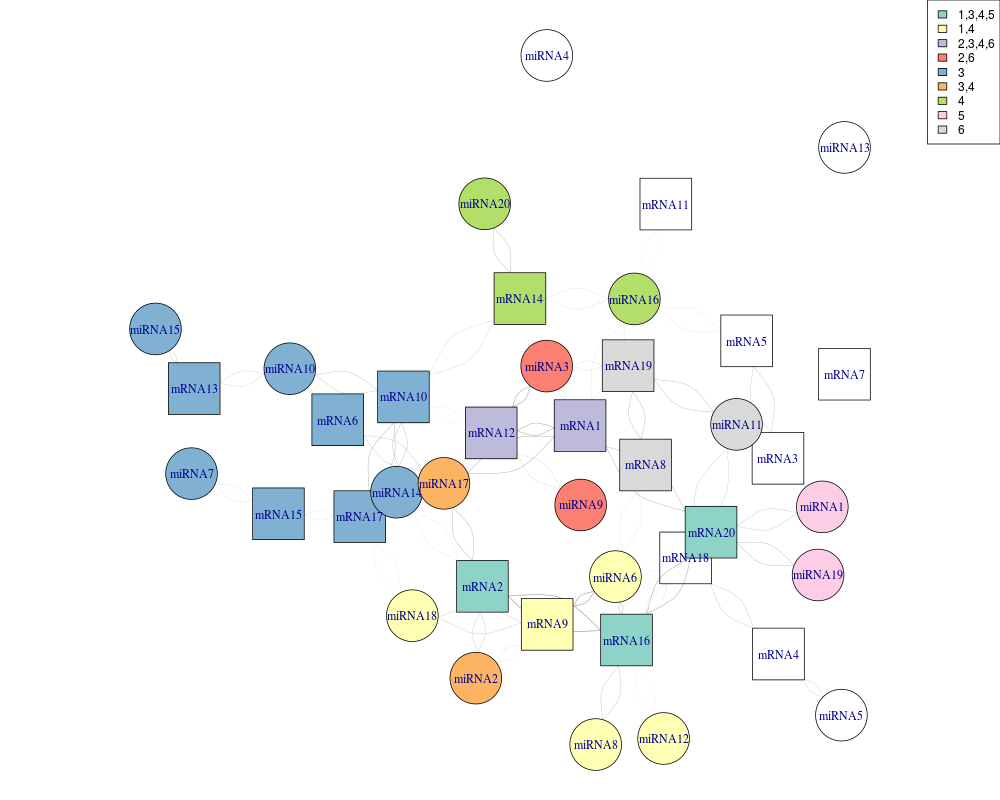
Plot module assignments.DescriptionPlot as network graphical view of the output from Usageplot_modules(V, W, H, legend.pos = "topright", ...) Arguments
DetailsEach node will be coloured by the modules they belong to. If a node belongs to multiple modules, it will be coloured differently based on the exact combination of the module indexes. The legend displays the corresponding colours and module assignments. NoteOnly for small network. For large network please use
Author(s)Yue Li Examples
load(system.file("extdata/toy_modules.RData", package="Mirsynergy"))

plot_modules(V,W,H)
Results
R version 3.3.1 (2016-06-21) -- "Bug in Your Hair"
Copyright (C) 2016 The R Foundation for Statistical Computing
Platform: x86_64-pc-linux-gnu (64-bit)

R is free software and comes with ABSOLUTELY NO WARRANTY.
You are welcome to redistribute it under certain conditions.
Type 'license()' or 'licence()' for distribution details.

R is a collaborative project with many contributors.
Type 'contributors()' for more information and
'citation()' on how to cite R or R packages in publications.

Type 'demo()' for some demos, 'help()' for on-line help, or
'help.start()' for an HTML browser interface to help.
Type 'q()' to quit R.

> library(Mirsynergy)
Loading required package: igraph

Attaching package: 'igraph'

The following objects are masked from 'package:stats':

    decompose, spectrum

The following object is masked from 'package:base':

    union

Loading required package: ggplot2
> png(filename="/home/ddbj/snapshot/RGM3/R_BC/result/Mirsynergy/plot_modules.Rd_%03d_medium.png", width=480, height=480)
> ### Name: plot_modules
> ### Title: Plot module assignments.
> ### Aliases: plot_modules
>
> ### ** Examples
>
> load(system.file("extdata/toy_modules.RData", package="Mirsynergy"))
>
> plot_modules(V,W,H)
>
>
>
>
>
>
> dev.off()
null device
          1
>
|