Supported by Dr. Osamu Ogasawara and  . . |
|
Last data update: 2014.03.03 |
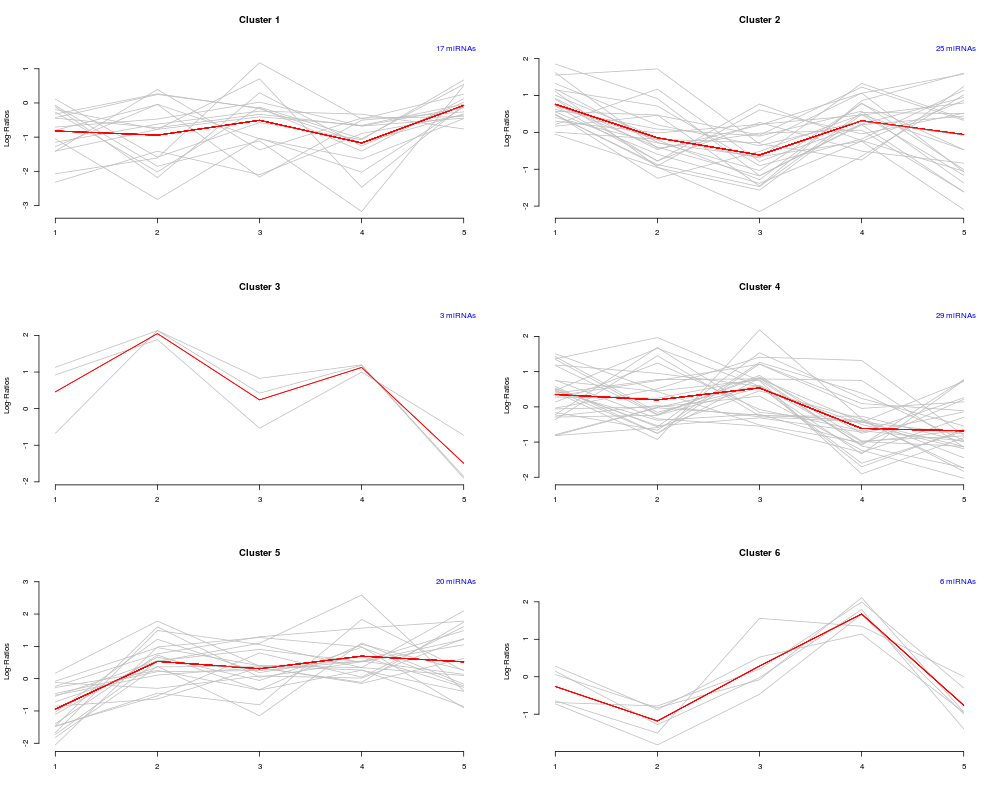
Plot expression profilesDescriptionProduces plots of clustered expression profiles, with seperate plots for each cluster. The average expression profile for each cluster is superimposed as well. UsageclustPlot(cl, mat, nrow, ncol) Arguments
DetailsThe figure region will be subdivided into ReferencesG.N. Brock, V. Pihur, S. Datta, and S. Datta. clValid, an R package for cluster validation. Journal of Statistical Software, 25, 2008. See AlsoSee the package vignette for illustration on usage Examples## generate some fake data and cluster set.seed(101) mat <- matrix(rnorm(500), nrow=100, ncol=5) clusts <- hclust(dist(mat)) cl <- cutree(clusts, 6) clustPlot(cl, mat, 3, 2) Results
R version 3.3.1 (2016-06-21) -- "Bug in Your Hair"
Copyright (C) 2016 The R Foundation for Statistical Computing
Platform: x86_64-pc-linux-gnu (64-bit)

R is free software and comes with ABSOLUTELY NO WARRANTY.
You are welcome to redistribute it under certain conditions.
Type 'license()' or 'licence()' for distribution details.

R is a collaborative project with many contributors.
Type 'contributors()' for more information and
'citation()' on how to cite R or R packages in publications.

Type 'demo()' for some demos, 'help()' for on-line help, or
'help.start()' for an HTML browser interface to help.
Type 'q()' to quit R.

> library(MmPalateMiRNA)
Loading required package: Biobase
Loading required package: BiocGenerics
Loading required package: parallel

Attaching package: 'BiocGenerics'

The following objects are masked from 'package:parallel':

    clusterApply, clusterApplyLB, clusterCall, clusterEvalQ,
    clusterExport, clusterMap, parApply, parCapply, parLapply,
    parLapplyLB, parRapply, parSapply, parSapplyLB

The following objects are masked from 'package:stats':

    IQR, mad, xtabs

The following objects are masked from 'package:base':

    Filter, Find, Map, Position, Reduce, anyDuplicated, append,
    as.data.frame, cbind, colnames, do.call, duplicated, eval, evalq,
    get, grep, grepl, intersect, is.unsorted, lapply, lengths, mapply,
    match, mget, order, paste, pmax, pmax.int, pmin, pmin.int, rank,
    rbind, rownames, sapply, setdiff, sort, table, tapply, union,
    unique, unsplit

Welcome to Bioconductor

    Vignettes contain introductory material; view with
    'browseVignettes()'. To cite Bioconductor, see
    'citation("Biobase")', and for packages 'citation("pkgname")'.

Loading required package: xtable
Loading required package: limma

Attaching package: 'limma'

The following object is masked from 'package:BiocGenerics':

    plotMA

Loading required package: statmod
Loading required package: lattice
Loading required package: vsn
> png(filename="/home/ddbj/snapshot/RGM3/R_BC/result/MmPalateMiRNA/clustPlot.Rd_%03d_medium.png", width=480, height=480)
> ### Name: clustPlot
> ### Title: Plot expression profiles
> ### Aliases: clustPlot
> ### Keywords: cluster
>
> ### ** Examples
>
>
> ## generate some fake data and cluster
> set.seed(101)
> mat <- matrix(rnorm(500), nrow=100, ncol=5)
> clusts <- hclust(dist(mat))
> cl <- cutree(clusts, 6)
> clustPlot(cl, mat, 3, 2)
>
>
>
>
>
>
> dev.off()
null device
          1
>
|
Created & Maintained by Osamu Ogasawara (osamu.ogasawara@gmail.com) and 