Either an RGList object,
or a list containing MAList
and/or NChannelSet objects
channel
The channel to use for calculating distances, one of
either "G" (green or control channel) or "R" (red or experimental
channel)
group
An optional character string specifying the name of a
factor to create separate panel displays, which must be in
x$genes (for RGList
objects)
subset
An optional character vector specifying the which levels
of group to use in creating separate panel displays
...
arguments to pass to densityplot
Methods
signature(x = "RGList", data = "missing")
For RGList objects, separate panel
displays
can be produced for different types of probes, as determined by the
group argument.
signature(x = "list", data = "missing")
The method for list objects is intended
to work with lists of normalized data sets, as either
MAList or
NChannelSet objects. This
method will produce separate panel displays for each normalized data
set, additionally subsetted by the group argument if supplied.
The useOuterStrips function in the latticeExtra package
can be used for ‘outer’ strip labels in the latter case.
References
D. Sarkar, R. Parkin, S. Wyman, A. Bendoraite, C. Sather, J. Delrow, A. K. Godwin,
C. Drescher, W. Huber, R. Gentleman, and M. Tewari.
Quality assessment and data analysis for microRNA expression arrays.
Nucleic Acids Res, 37(2):e17, 2009.
See Also
levelplot for pairwise distance
plots between arrays,
MADvsMedianPlot for median
absolute deviation versus median plots, and
MAplot for MA plots
R version 3.3.1 (2016-06-21) -- "Bug in Your Hair"
Copyright (C) 2016 The R Foundation for Statistical Computing
Platform: x86_64-pc-linux-gnu (64-bit)
R is free software and comes with ABSOLUTELY NO WARRANTY.
You are welcome to redistribute it under certain conditions.
Type 'license()' or 'licence()' for distribution details.
R is a collaborative project with many contributors.
Type 'contributors()' for more information and
'citation()' on how to cite R or R packages in publications.
Type 'demo()' for some demos, 'help()' for on-line help, or
'help.start()' for an HTML browser interface to help.
Type 'q()' to quit R.
> library(MmPalateMiRNA)
Loading required package: Biobase
Loading required package: BiocGenerics
Loading required package: parallel
Attaching package: 'BiocGenerics'
The following objects are masked from 'package:parallel':
clusterApply, clusterApplyLB, clusterCall, clusterEvalQ,
clusterExport, clusterMap, parApply, parCapply, parLapply,
parLapplyLB, parRapply, parSapply, parSapplyLB
The following objects are masked from 'package:stats':
IQR, mad, xtabs
The following objects are masked from 'package:base':
Filter, Find, Map, Position, Reduce, anyDuplicated, append,
as.data.frame, cbind, colnames, do.call, duplicated, eval, evalq,
get, grep, grepl, intersect, is.unsorted, lapply, lengths, mapply,
match, mget, order, paste, pmax, pmax.int, pmin, pmin.int, rank,
rbind, rownames, sapply, setdiff, sort, table, tapply, union,
unique, unsplit
Welcome to Bioconductor
Vignettes contain introductory material; view with
'browseVignettes()'. To cite Bioconductor, see
'citation("Biobase")', and for packages 'citation("pkgname")'.
Loading required package: xtable
Loading required package: limma
Attaching package: 'limma'
The following object is masked from 'package:BiocGenerics':
plotMA
Loading required package: statmod
Loading required package: lattice
Loading required package: vsn
> png(filename="/home/ddbj/snapshot/RGM3/R_BC/result/MmPalateMiRNA/densityplot.Rd_%03d_medium.png", width=480, height=480)
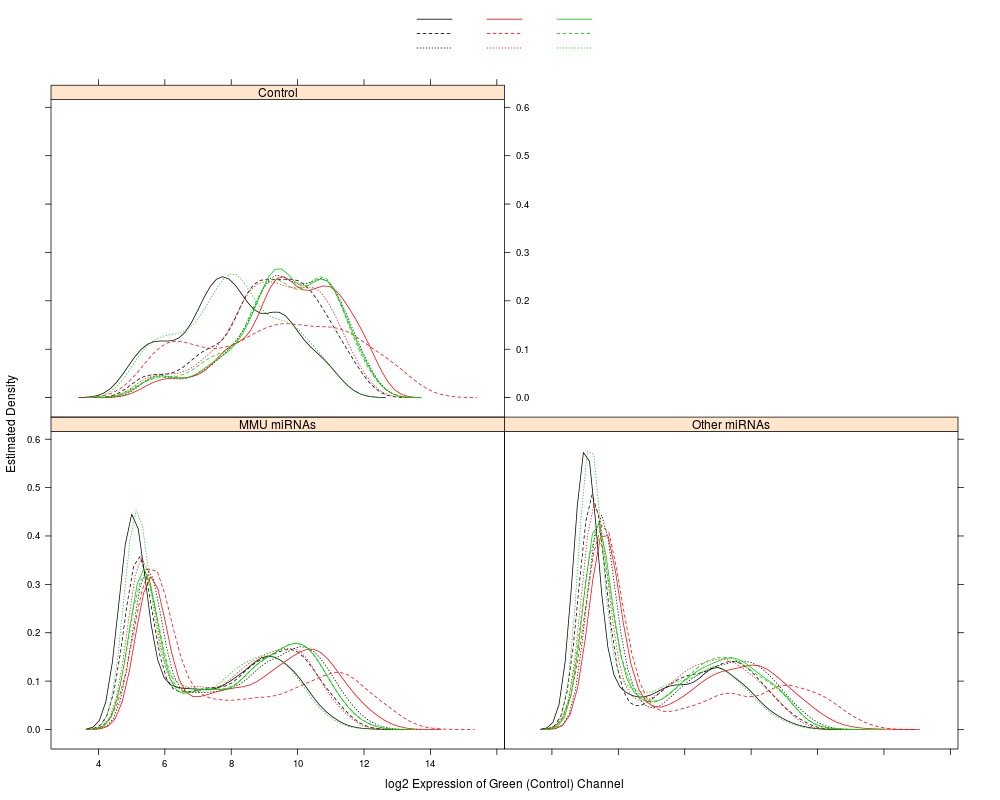
> ### Name: densityplot
> ### Title: Density plots of log2 intensity values
> ### Aliases: densityplot densityplot-methods
> ### densityplot,RGList,missing-method densityplot,list,missing-method
> ### Keywords: methods hplot
>
> ### ** Examples
>
> data(PalateData)
> res <- densityplot(PalateData, channel="G", group="probe.type",
+ subset = c("Other miRNAs", "MMU miRNAs", "Control"),
+ col=rep(1:3, each=3), lty=rep(1:3, 3),
+ key = list(lines=list(col=rep(1:3, each=3), lty=rep(1:3, 3)),
+ columns=3))
> print(res)
>
>
>
>
>
> dev.off()
null device
1
>
 .
.