Supported by Dr. Osamu Ogasawara and  . . |
|
Last data update: 2014.03.03 |
Plot MotivDescriptionThis functions are used to vizualise and validate Usage
	## S4 method for signature 'motiv,ANY'
plot(x, y=NULL, main=NULL, sub=NULL, ncol=0, nrow=0, top=3, bysim=TRUE, rev=FALSE, trim=0.05, cex)

	## S4 method for signature 'motiv,gadem'
plot(x, y, sort=FALSE, group=FALSE, main=NULL, sub=NULL, ncol=0, nrow=0, xlim=NULL, correction=TRUE,  bysim=TRUE, strand=FALSE, type="distribution", trim=0.05, col=c("blue", "red"), border=c("black", "black"), lwd=2, lty=1, nclass=20, bw="nrd0", cex=1, vcol=c("red", "green"))
Arguments
DetailsA single Giving a A
The With Author(s)Eloi Mercier <emercier@chibi.ubc.ca> Examples
#####Database and Scores#####
path <- system.file(package="MotIV")
jaspar <- readPWMfile(paste(path,"/extdata/jaspar2010.txt",sep=""))
jaspar.scores <- readDBScores(paste(path,"/extdata/jaspar2010_PCC_SWU.scores",sep=""))
#####Input#####
data(FOXA1_rGADEM)
motifs <- getPWM(gadem)
motifs.trimed <- lapply(motifs,trimPWMedge, threshold=1)
#####Analysis#####
foxa1.analysis.jaspar <- motifMatch(inputPWM=motifs,align="SWU",cc="PCC",database=jaspar,DBscores=jaspar.scores,top=5)
summary(foxa1.analysis.jaspar )
#####Filters#####
f.foxa1<-setFilter(name="", tfname="FOXA1", top=3, evalueMax=10^-5)
f.ap1 <- setFilter (tfname="AP1", top=3)
f.foxa1.ap1 <- f.foxa1 | f.ap1
foxa1.filter <- filter(foxa1.analysis.jaspar, f.foxa1.ap1, exact=FALSE, verbose=TRUE)
foxa1.split <- split(foxa1.analysis.jaspar, c(f.foxa1, f.ap1) , drop=FALSE, exact=FALSE, verbose=TRUE)
foxa1.filter.combine <- combineMotifs(foxa1.filter, c(f.foxa1, f.ap1), exact=FALSE, name=c("FOXA1", "AP1"), verbose=TRUE)
#####Plots#####
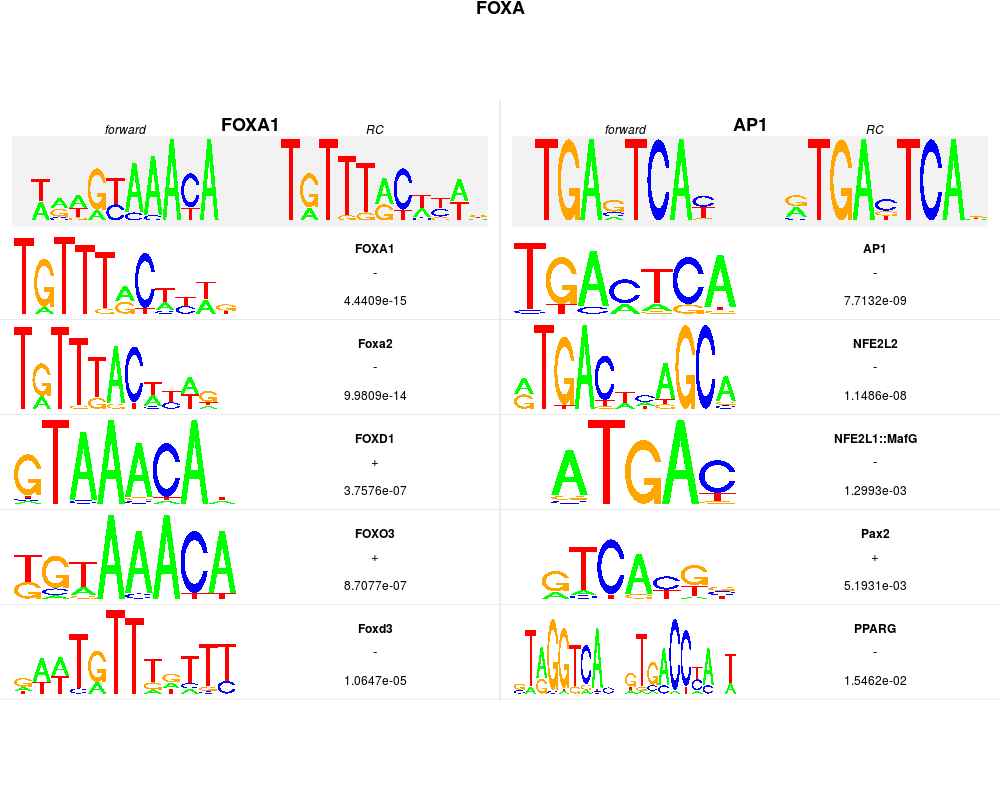
plot(foxa1.filter.combine, ncol=2,top=5, rev=FALSE, main="FOXA", bysim=TRUE)
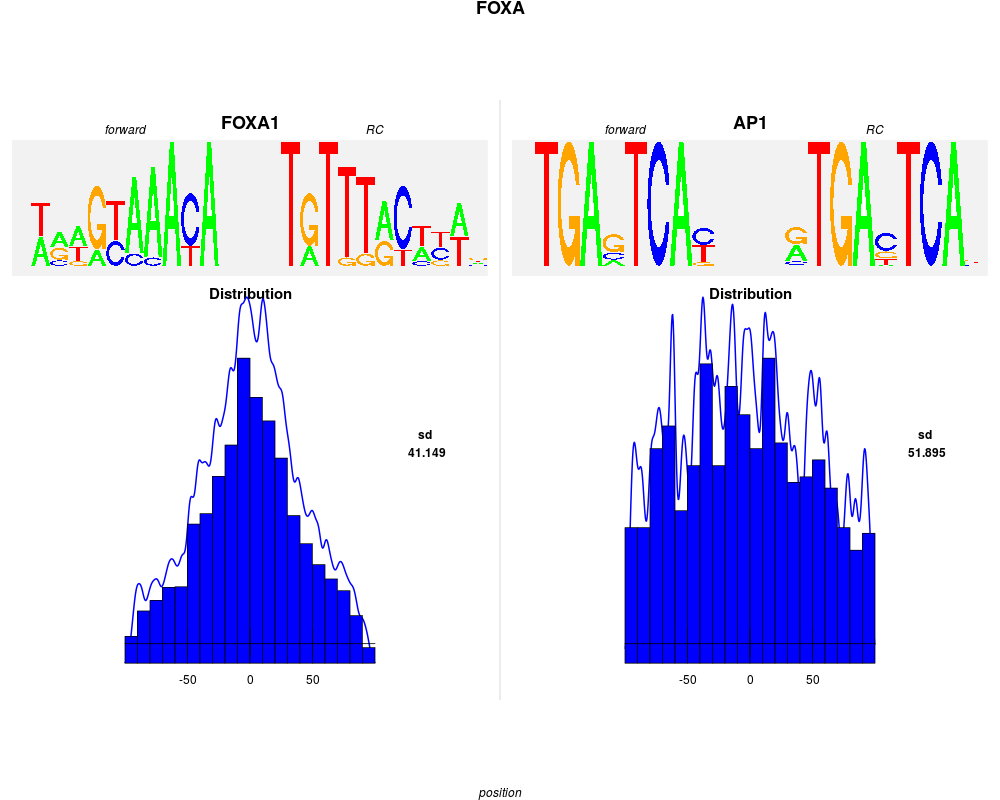
plot(foxa1.filter.combine ,gadem,ncol=2, type="distribution", correction=TRUE, group=FALSE, bysim=TRUE, strand=FALSE, sort=TRUE, main="FOXA", nclass=20, bw=2)
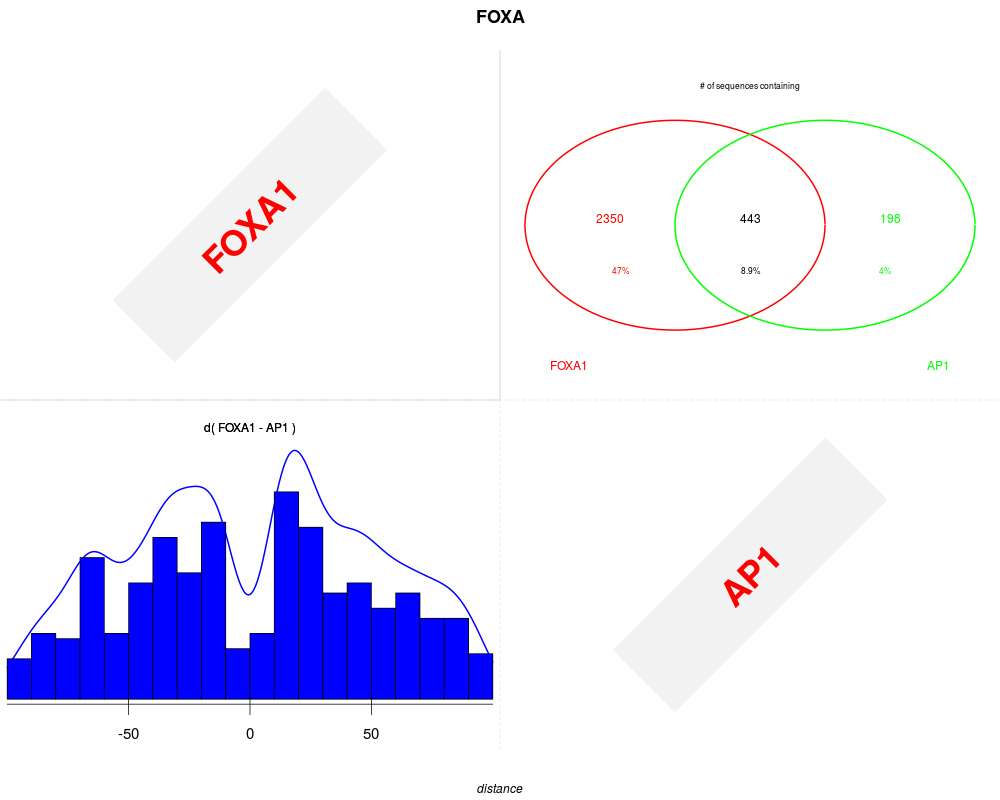
plot(foxa1.filter.combine ,gadem,type="distance", correction=TRUE, group=TRUE, bysim=TRUE, main="FOXA", strand=FALSE, xlim=c(-100,100), nclass=20, bw=8)
Results
R version 3.3.1 (2016-06-21) -- "Bug in Your Hair"
Copyright (C) 2016 The R Foundation for Statistical Computing
Platform: x86_64-pc-linux-gnu (64-bit)

R is free software and comes with ABSOLUTELY NO WARRANTY.
You are welcome to redistribute it under certain conditions.
Type 'license()' or 'licence()' for distribution details.

R is a collaborative project with many contributors.
Type 'contributors()' for more information and
'citation()' on how to cite R or R packages in publications.

Type 'demo()' for some demos, 'help()' for on-line help, or
'help.start()' for an HTML browser interface to help.
Type 'q()' to quit R.

> library(MotIV)
Loading required package: BiocGenerics
Loading required package: parallel

Attaching package: 'BiocGenerics'

The following objects are masked from 'package:parallel':

    clusterApply, clusterApplyLB, clusterCall, clusterEvalQ,
    clusterExport, clusterMap, parApply, parCapply, parLapply,
    parLapplyLB, parRapply, parSapply, parSapplyLB

The following objects are masked from 'package:stats':

    IQR, mad, xtabs

The following objects are masked from 'package:base':

    Filter, Find, Map, Position, Reduce, anyDuplicated, append,
    as.data.frame, cbind, colnames, do.call, duplicated, eval, evalq,
    get, grep, grepl, intersect, is.unsorted, lapply, lengths, mapply,
    match, mget, order, paste, pmax, pmax.int, pmin, pmin.int, rank,
    rbind, rownames, sapply, setdiff, sort, table, tapply, union,
    unique, unsplit


Attaching package: 'MotIV'

The following object is masked from 'package:stats':

    filter

> png(filename="/home/ddbj/snapshot/RGM3/R_BC/result/MotIV/plot.Rd_%03d_medium.png", width=480, height=480)
> ### Name: plot-methods
> ### Title: Plot Motiv
> ### Aliases: plot-methods plot,motiv,ANY-method plot,motiv-method
> ###   plot,motiv,gadem-method plot,motiv,gadem-method plot
> ### Keywords: methods
>
> ### ** Examples
>
> #####Database and Scores#####
> path <- system.file(package="MotIV")
> jaspar <- readPWMfile(paste(path,"/extdata/jaspar2010.txt",sep=""))
> jaspar.scores <- readDBScores(paste(path,"/extdata/jaspar2010_PCC_SWU.scores",sep=""))
>
> #####Input#####
> data(FOXA1_rGADEM)
> motifs <- getPWM(gadem)
> motifs.trimed <- lapply(motifs,trimPWMedge, threshold=1)
> #####Analysis#####
> foxa1.analysis.jaspar <- motifMatch(inputPWM=motifs,align="SWU",cc="PCC",database=jaspar,DBscores=jaspar.scores,top=5)

	Ungapped Alignment
	Scores read
	Database read
	Motif matches : 5
> summary(foxa1.analysis.jaspar )
	Number of input motifs :  7
	Input motifs names :  m1 m2 m3 m4 m5 m6 m7
	Number of matches per motif:  5
	Matches repartition :
        Egr1        Foxd3        INSM1       NFE2L2            T  Tal1::Gata1
           2            2            2            2            2            2
         AP1         ESR1   EWSR1-FLI1          FEV        FOXA1        FOXD1
           1            1            1            1            1            1
       FOXI1        FOXO3        Foxa2         Klf4          Myf NFE2L1::MafG
           1            1            1            1            1            1
       PLAG1        PPARG  PPARG::RXRA         Pax2         REST        RREB1
           1            1            1            1            1            1
         SP1         SPI1         SPIB          SRF        Stat3
           1            1            1            1            1
	Arguments used :
	  -metric name :  PCC
	  -alignment :  SWU

>
> #####Filters#####
> f.foxa1<-setFilter(name="", tfname="FOXA1", top=3, evalueMax=10^-5)
> f.ap1 <- setFilter (tfname="AP1", top=3)
> f.foxa1.ap1 <- f.foxa1 | f.ap1
> foxa1.filter <- filter(foxa1.analysis.jaspar, f.foxa1.ap1, exact=FALSE, verbose=TRUE)
motiv object contains 7 motifs.
motivFilter selected 2 motifs.
> foxa1.split <- split(foxa1.analysis.jaspar, c(f.foxa1, f.ap1) , drop=FALSE, exact=FALSE, verbose=TRUE)
motiv object contains 7 motifs.
1 motifs selected for 'filter1'
1 motifs selected for 'filter2'
5 remaining motifs selected.
> foxa1.filter.combine <- combineMotifs(foxa1.filter, c(f.foxa1, f.ap1), exact=FALSE, name=c("FOXA1", "AP1"), verbose=TRUE)
motiv object contains 2 motifs.
1 motifs combined : m1
1 motifs combined : m6
>
> #####Plots#####
> plot(foxa1.filter.combine, ncol=2,top=5, rev=FALSE, main="FOXA", bysim=TRUE)
There were 14 warnings (use warnings() to see them)
> plot(foxa1.filter.combine ,gadem,ncol=2, type="distribution", correction=TRUE, group=FALSE, bysim=TRUE, strand=FALSE, sort=TRUE, main="FOXA", nclass=20, bw=2)
Warning messages:
1: In max(letters$id) : no non-missing arguments to max; returning -Inf
2: In max(letters$id) : no non-missing arguments to max; returning -Inf
3: In max(letters$id) : no non-missing arguments to max; returning -Inf
4: In max(letters$id) : no non-missing arguments to max; returning -Inf
> plot(foxa1.filter.combine ,gadem,type="distance", correction=TRUE, group=TRUE, bysim=TRUE, main="FOXA", strand=FALSE, xlim=c(-100,100), nclass=20, bw=8)
>
>
>
>
>
> dev.off()
null device
          1
>
|