## S3 method for class 'NHEMOtree'
plot(x, data, which = c("Pareto", "S_Metric", "VIMS", "Tree"), vim = 0, ...)
Arguments
x
An object of class NHEMOtree.
data
Data which was used in NHEMOtree.
which
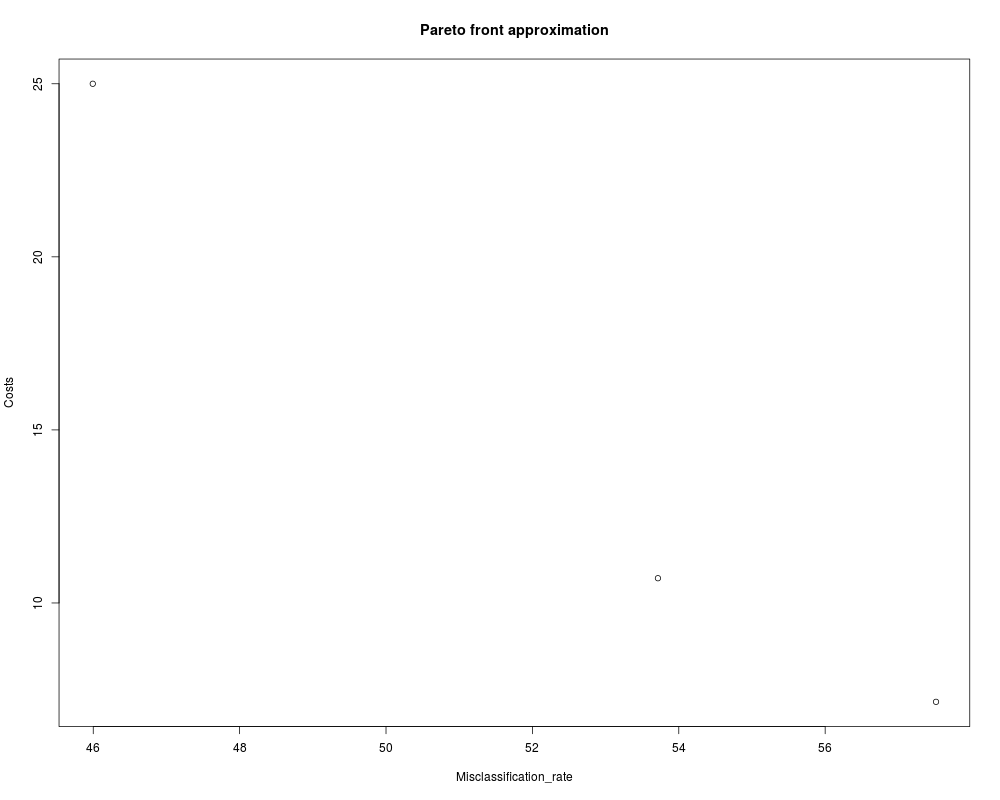
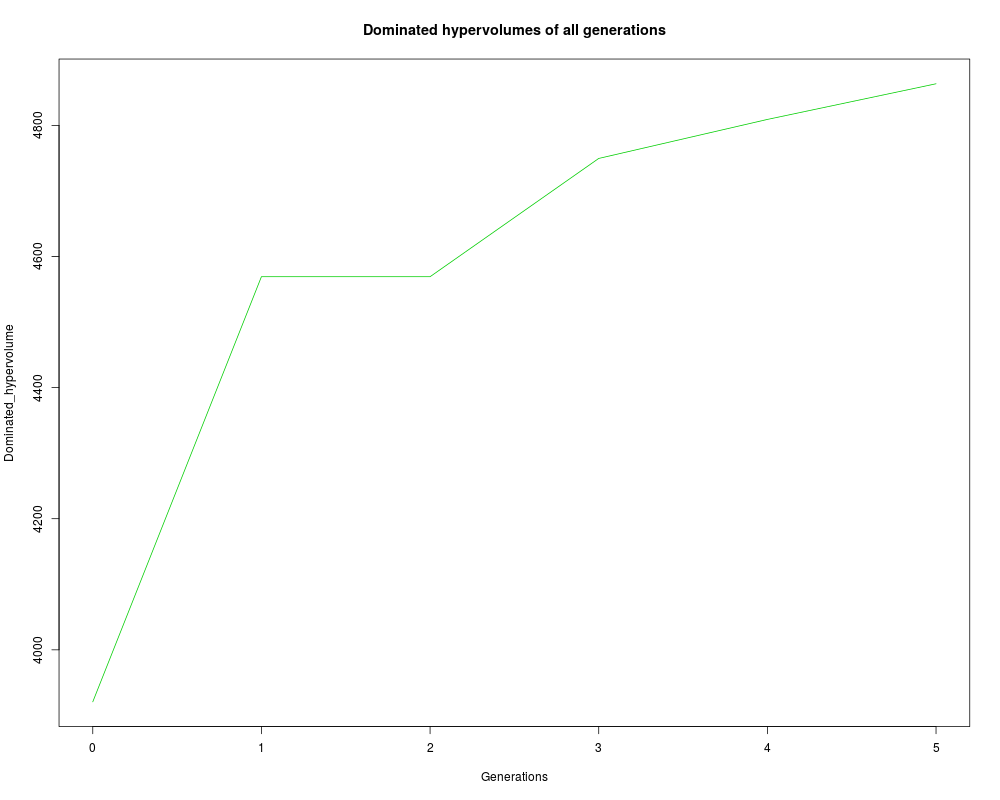
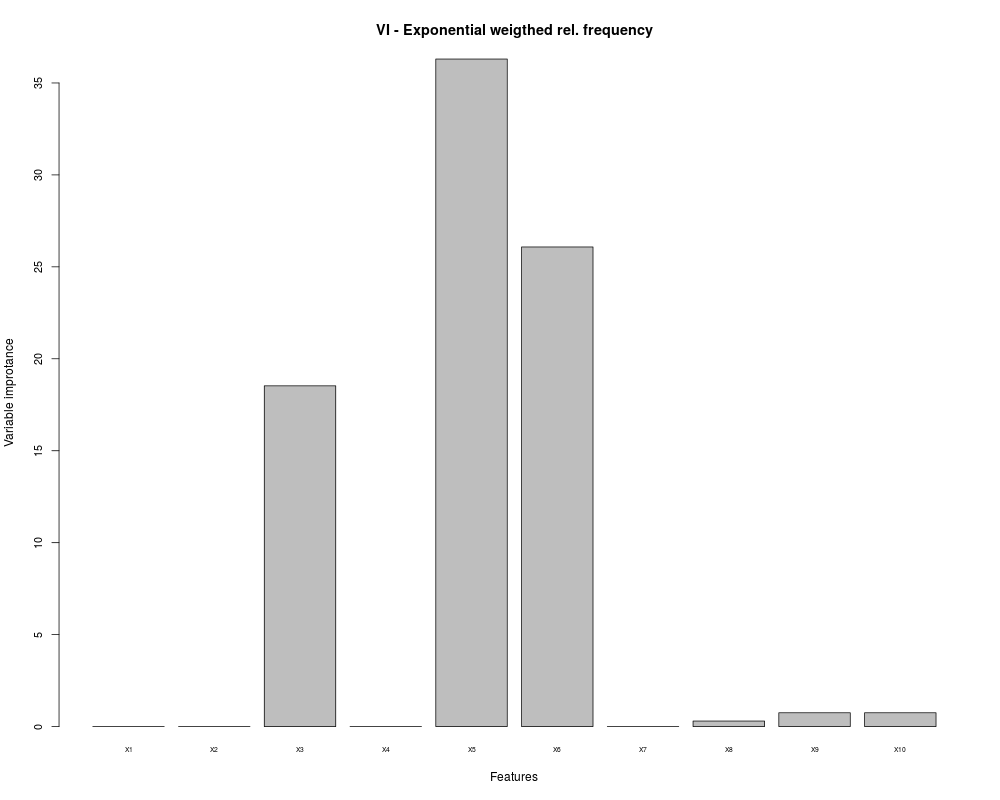
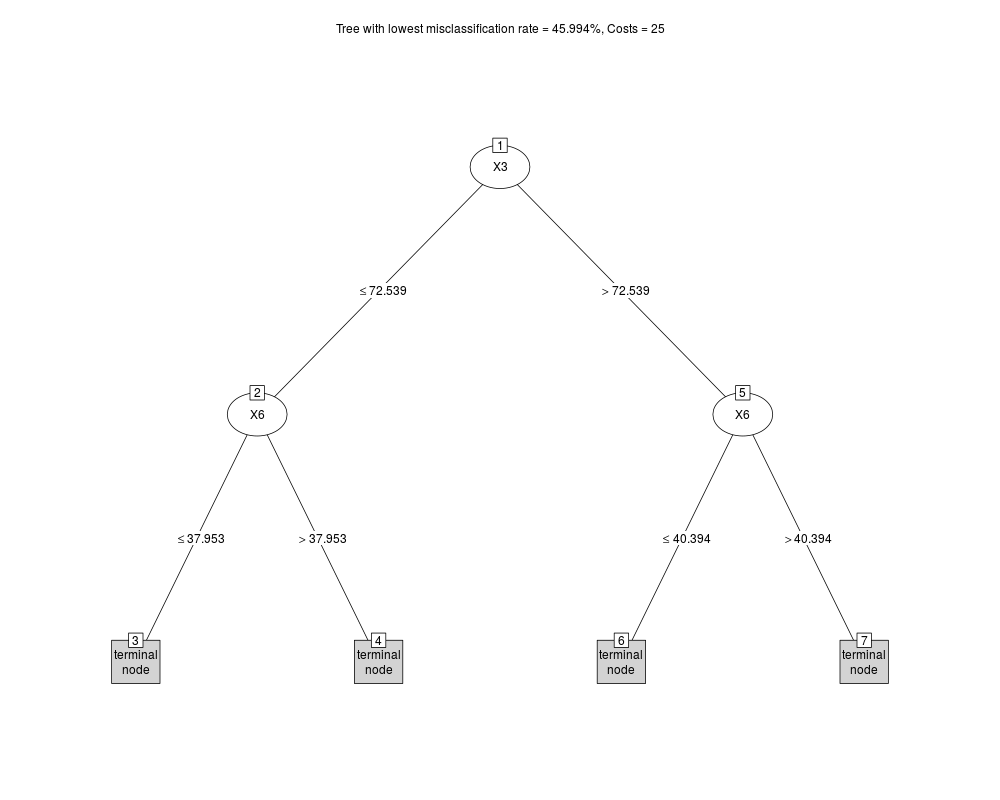
Type of plot, "Pareto" for the final Pareto front, "S_Metric" for increase of the dominated hypervolume by generation, "VIMS" for variable improtance for each explanatory variable, "Tree" for the individual with the lowest misclassification rate.
vim
Variable improtance measure to be plottet for which="VIMS", vim=1 for 'simple absolute frequency', vim=2 for 'simple relative frequency', vim=3 for 'relative frequency', vim=4 for 'linear weigthed relative frequency', vim=5 for 'exponential weigthed relative frequency', vim=6 for 'permutation accuracy importance' (default: plots for all VIMs).
...
Arguments passed to or from other methods.
Author(s)
Swaantje Casjens
See Also
NHEMOtree
Examples
# Simulation of data and costs
  d         <- Sim_Data(Obs=200)
  CostMatrix<- Sim_Costs()

  res<- NHEMOtree(type="NHEMO", formula=Y2~., data=d, CostMatrix=CostMatrix,
                  gens=5, popsize=5, crossover_prob=0.1, mutation_prob=0.1)
  plot(data=d, x=res, which="P")
  plot(data=d, x=res, which="S", col=3, type="l")
  plot(data=d, x=res, which="V", vim=5)
  plot(data=d, x=res, which="T")
Results
R version 3.3.1 (2016-06-21) -- "Bug in Your Hair"
Copyright (C) 2016 The R Foundation for Statistical Computing
Platform: x86_64-pc-linux-gnu (64-bit)

R is free software and comes with ABSOLUTELY NO WARRANTY.
You are welcome to redistribute it under certain conditions.
Type 'license()' or 'licence()' for distribution details.

R is a collaborative project with many contributors.
Type 'contributors()' for more information and
'citation()' on how to cite R or R packages in publications.

Type 'demo()' for some demos, 'help()' for on-line help, or
'help.start()' for an HTML browser interface to help.
Type 'q()' to quit R.

> library(NHEMOtree)
Loading required package: partykit
Loading required package: grid
Loading required package: emoa
Loading required package: sets
Loading required package: rpart
> png(filename="/home/ddbj/snapshot/RGM3/R_CC/result/NHEMOtree/plot.NHEMOtree.Rd_%03d_medium.png", width=480, height=480)
> ### Name: plot.NHEMOtree
> ### Title: Plot Method for Class NHEMOtree
> ### Aliases: plot.NHEMOtree
> ### Keywords: Plots for NHEMOtree Multi-objective optimization Evolutionary
> ###   algorithms Classification
>
> ### ** Examples
>
> # Simulation of data and costs
>   d         <- Sim_Data(Obs=200)
>   CostMatrix<- Sim_Costs()
>
>   res<- NHEMOtree(type="NHEMO", formula=Y2~., data=d, CostMatrix=CostMatrix,
+                   gens=5, popsize=5, crossover_prob=0.1, mutation_prob=0.1)
>   plot(data=d, x=res, which="P")
>   plot(data=d, x=res, which="S", col=3, type="l")
>   plot(data=d, x=res, which="V", vim=5)
>   plot(data=d, x=res, which="T")
>
>
>
>
>
> dev.off()
null device
          1
>
 .
.