Supported by Dr. Osamu Ogasawara and  . . |
|
Last data update: 2014.03.03 |
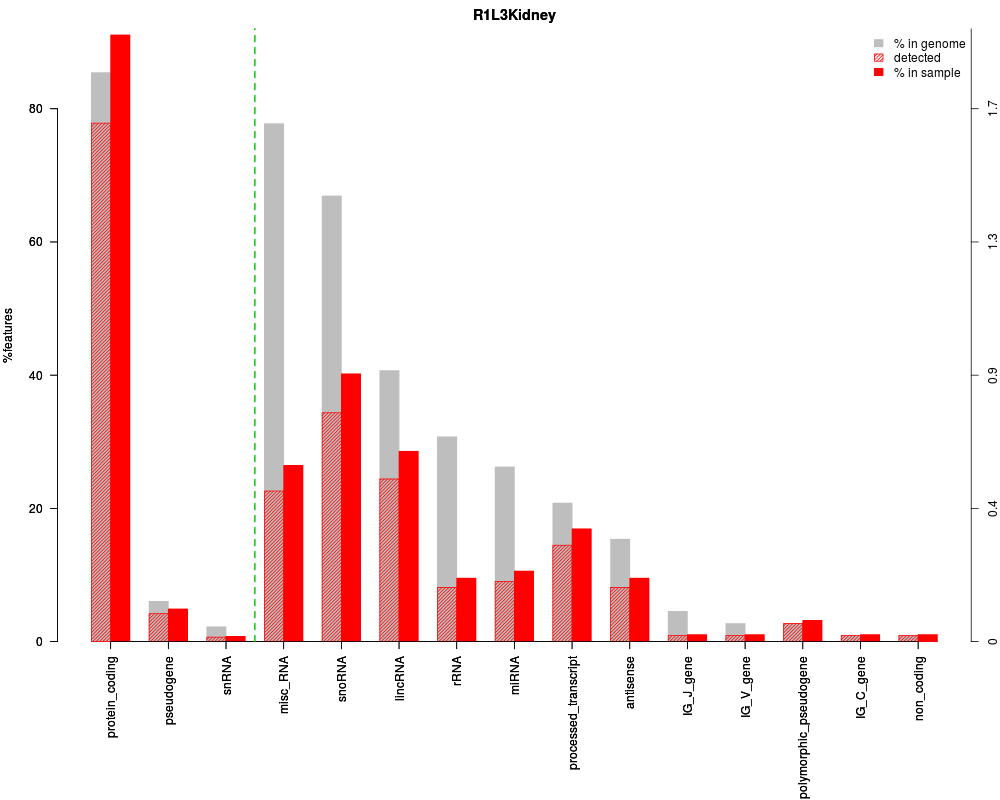
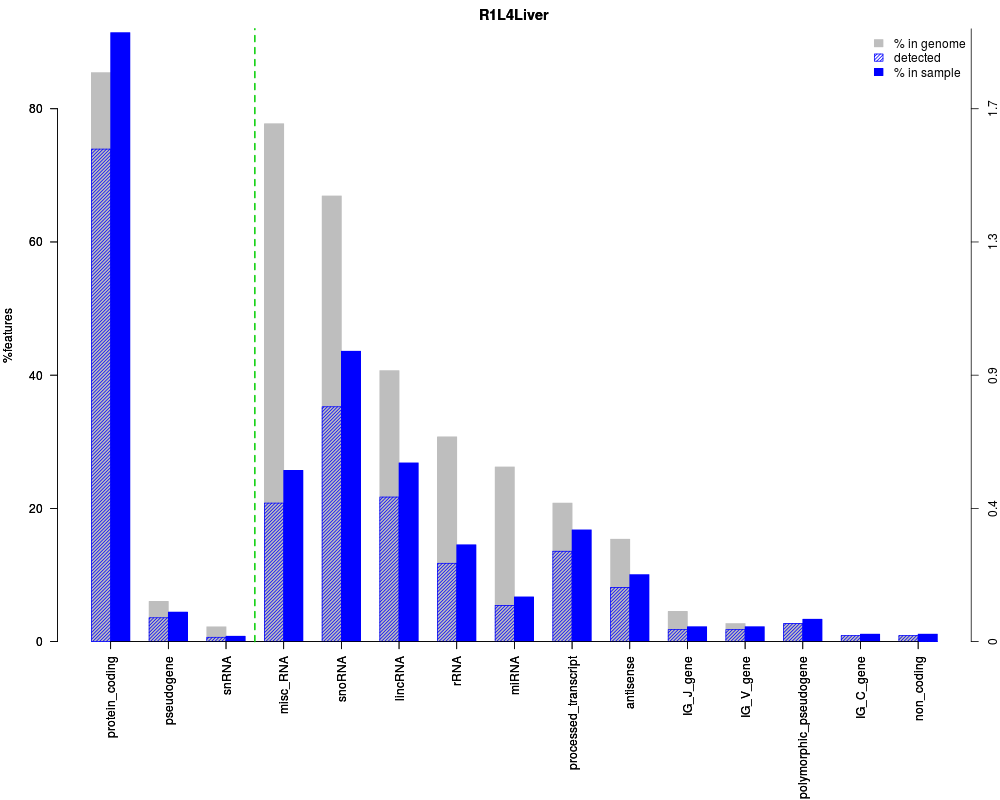
Exploration of expression data.DescriptionTake the expression data and the feature annotations to generate the results that will be used for the exploratory plots ( Usage
dat(input, type = c("biodetection","cd","countsbio","GCbias","lengthbias","saturation","PCA"),
                    k = 0, ndepth = 6, factor = NULL, norm = FALSE, refColumn = 1, logtransf = FALSE)
Arguments
Value
Author(s)Sonia Tarazona See Also
Examples## Load the input object with the expression data and the annotations data(myCounts) ## Generating data for the plot "biodetection" and samples in columns 3 and 4 of expression data mydata2plot = dat(mydata, type = "biodetection", k = 0) ## Generating the corresponding plot explo.plot(mydata2plot, samples = c(3,4)) Results
R version 3.3.1 (2016-06-21) -- "Bug in Your Hair"
Copyright (C) 2016 The R Foundation for Statistical Computing
Platform: x86_64-pc-linux-gnu (64-bit)

R is free software and comes with ABSOLUTELY NO WARRANTY.
You are welcome to redistribute it under certain conditions.
Type 'license()' or 'licence()' for distribution details.

R is a collaborative project with many contributors.
Type 'contributors()' for more information and
'citation()' on how to cite R or R packages in publications.

Type 'demo()' for some demos, 'help()' for on-line help, or
'help.start()' for an HTML browser interface to help.
Type 'q()' to quit R.

> library(NOISeq)
Loading required package: Biobase
Loading required package: BiocGenerics
Loading required package: parallel

Attaching package: 'BiocGenerics'

The following objects are masked from 'package:parallel':

    clusterApply, clusterApplyLB, clusterCall, clusterEvalQ,
    clusterExport, clusterMap, parApply, parCapply, parLapply,
    parLapplyLB, parRapply, parSapply, parSapplyLB

The following objects are masked from 'package:stats':

    IQR, mad, xtabs

The following objects are masked from 'package:base':

    Filter, Find, Map, Position, Reduce, anyDuplicated, append,
    as.data.frame, cbind, colnames, do.call, duplicated, eval, evalq,
    get, grep, grepl, intersect, is.unsorted, lapply, lengths, mapply,
    match, mget, order, paste, pmax, pmax.int, pmin, pmin.int, rank,
    rbind, rownames, sapply, setdiff, sort, table, tapply, union,
    unique, unsplit

Welcome to Bioconductor

    Vignettes contain introductory material; view with
    'browseVignettes()'. To cite Bioconductor, see
    'citation("Biobase")', and for packages 'citation("pkgname")'.

Loading required package: splines
Loading required package: Matrix
> png(filename="/home/ddbj/snapshot/RGM3/R_BC/result/NOISeq/dat.Rd_%03d_medium.png", width=480, height=480)
> ### Name: Data_Exploration
> ### Title: Exploration of expression data.
> ### Aliases: dat
>
> ### ** Examples
>
> ## Load the input object with the expression data and the annotations
> data(myCounts)
>
> ## Generating data for the plot "biodetection" and samples in columns 3 and 4 of expression data
> mydata2plot = dat(mydata, type = "biodetection", k = 0)
Biotypes detection is to be computed for:
 [1] "R1L1Kidney" "R1L2Liver"  "R1L3Kidney" "R1L4Liver"  "R1L6Liver"
 [6] "R1L7Kidney" "R1L8Liver"  "R2L2Kidney" "R2L3Liver"  "R2L6Kidney"
>
> ## Generating the corresponding plot
> explo.plot(mydata2plot, samples = c(3,4))
Warning messages:
1: In if (plottype == "persample") { :
  the condition has length > 1 and only the first element will be used
2: In if (plottype == "comparison") { :
  the condition has length > 1 and only the first element will be used
>
>
>
>
>
>
> dev.off()
null device
          1
>
|