Supported by Dr. Osamu Ogasawara and  . . |
|
Last data update: 2014.03.03 |
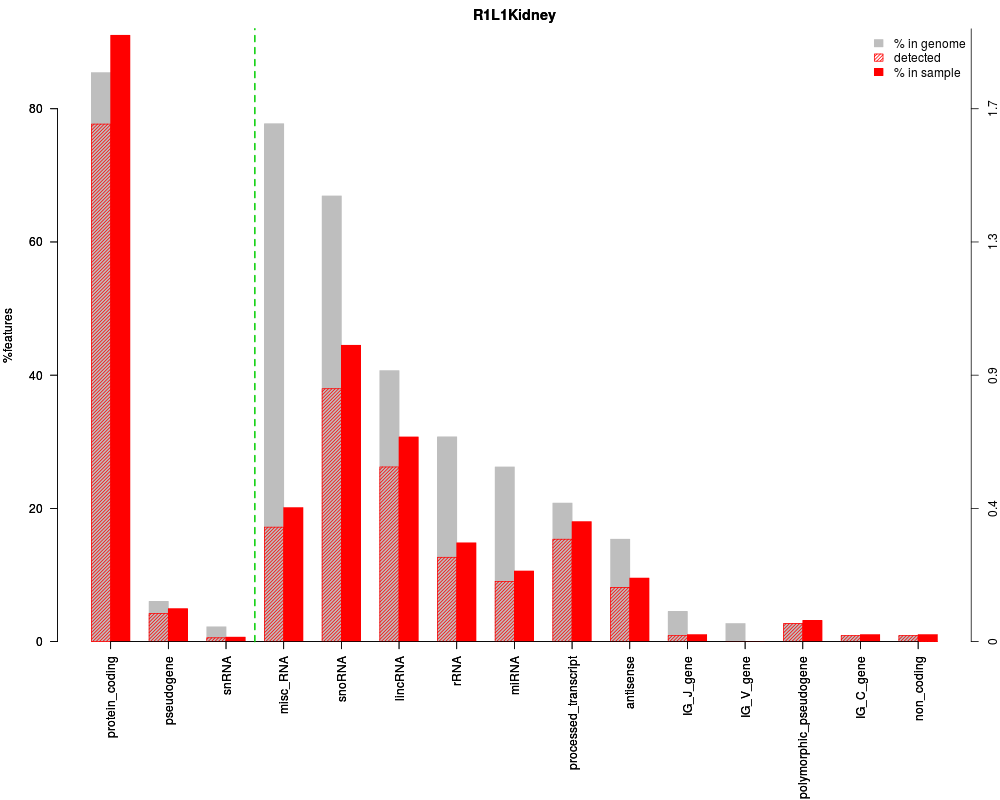
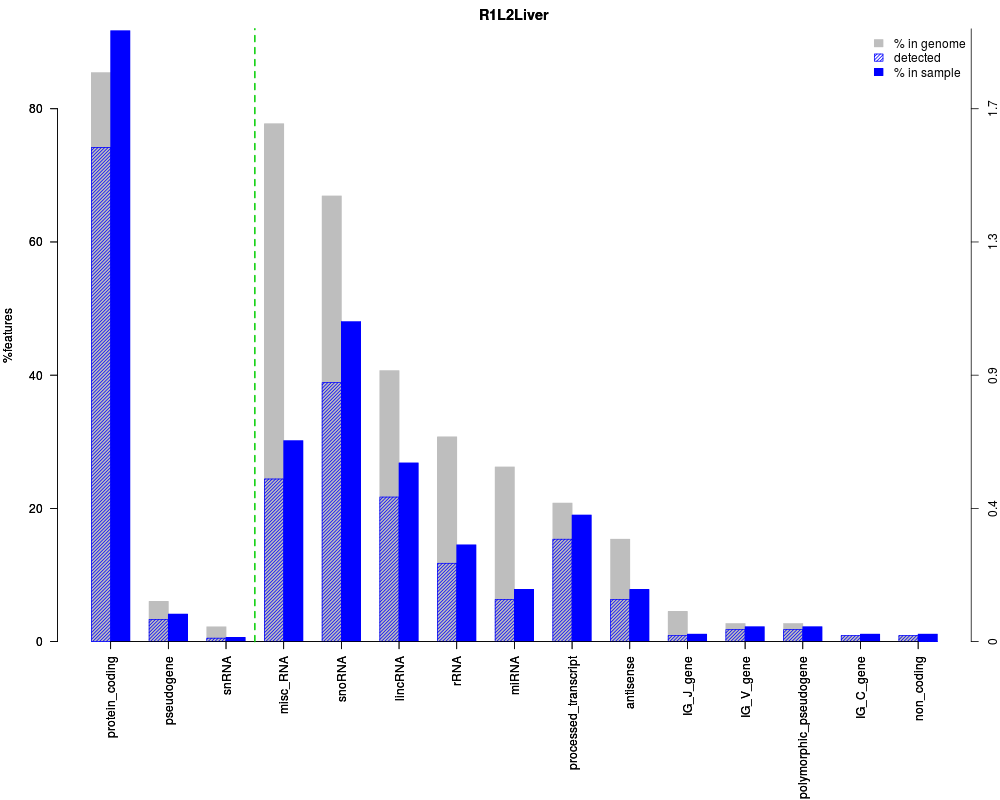
Exploratory plots for expression data.DescriptionStandard generic function. Different types of plots showing the biological classification for detected features, the expression distribution across samples or biological groups, the detection of technical bias such as length, GCcontent or RNA composition, the dependence of expression on sequencing depth, etc. Usageexplo.plot(object, ...) Arguments
ValueThe explo.plot() function takes the object generated by dat() and draws the corresponding plot. Author(s)Sonia Tarazona See Also
Examples## Load the input object with the expression data and the annotations data(myCounts) ## Generating data for the plot "biodetection" and samples in columns 3 and 4 of expression data mydata2plot = dat(mydata, type = "biodetection", k = 0) ## Generating the corresponding plot explo.plot(mydata2plot) Results
R version 3.3.1 (2016-06-21) -- "Bug in Your Hair"
Copyright (C) 2016 The R Foundation for Statistical Computing
Platform: x86_64-pc-linux-gnu (64-bit)

R is free software and comes with ABSOLUTELY NO WARRANTY.
You are welcome to redistribute it under certain conditions.
Type 'license()' or 'licence()' for distribution details.

R is a collaborative project with many contributors.
Type 'contributors()' for more information and
'citation()' on how to cite R or R packages in publications.

Type 'demo()' for some demos, 'help()' for on-line help, or
'help.start()' for an HTML browser interface to help.
Type 'q()' to quit R.

> library(NOISeq)
Loading required package: Biobase
Loading required package: BiocGenerics
Loading required package: parallel

Attaching package: 'BiocGenerics'

The following objects are masked from 'package:parallel':

    clusterApply, clusterApplyLB, clusterCall, clusterEvalQ,
    clusterExport, clusterMap, parApply, parCapply, parLapply,
    parLapplyLB, parRapply, parSapply, parSapplyLB

The following objects are masked from 'package:stats':

    IQR, mad, xtabs

The following objects are masked from 'package:base':

    Filter, Find, Map, Position, Reduce, anyDuplicated, append,
    as.data.frame, cbind, colnames, do.call, duplicated, eval, evalq,
    get, grep, grepl, intersect, is.unsorted, lapply, lengths, mapply,
    match, mget, order, paste, pmax, pmax.int, pmin, pmin.int, rank,
    rbind, rownames, sapply, setdiff, sort, table, tapply, union,
    unique, unsplit

Welcome to Bioconductor

    Vignettes contain introductory material; view with
    'browseVignettes()'. To cite Bioconductor, see
    'citation("Biobase")', and for packages 'citation("pkgname")'.

Loading required package: splines
Loading required package: Matrix
> png(filename="/home/ddbj/snapshot/RGM3/R_BC/result/NOISeq/explo.plot.Rd_%03d_medium.png", width=480, height=480)
> ### Name: Exploratory_Plots
> ### Title: Exploratory plots for expression data.
> ### Aliases: explo.plot
>
> ### ** Examples
>
> ## Load the input object with the expression data and the annotations
> data(myCounts)
>
> ## Generating data for the plot "biodetection" and samples in columns 3 and 4 of expression data
> mydata2plot = dat(mydata, type = "biodetection", k = 0)
Biotypes detection is to be computed for:
 [1] "R1L1Kidney" "R1L2Liver"  "R1L3Kidney" "R1L4Liver"  "R1L6Liver"
 [6] "R1L7Kidney" "R1L8Liver"  "R2L2Kidney" "R2L3Liver"  "R2L6Kidney"
>
> ## Generating the corresponding plot
> explo.plot(mydata2plot)
Warning messages:
1: In if (plottype == "persample") { :
  the condition has length > 1 and only the first element will be used
2: In if (plottype == "comparison") { :
  the condition has length > 1 and only the first element will be used
>
>
>
>
>
>
> dev.off()
null device
          1
>
|
Created & Maintained by Osamu Ogasawara (osamu.ogasawara@gmail.com) and 