Supported by Dr. Osamu Ogasawara and  . . |
|
Last data update: 2014.03.03 |
A graph layout function, which groups vertices by attribute.DescriptionThis function generates a layout for igraph objects, keeping vertices with the same attribute (ex: in the same pathway, etc) close to each other. UsagelayoutVertexByAttr(graph, attr.name, cluster.strength = 1, layout = layout.auto) Arguments
ValueA two-column matrix indicating the x and y postions of vertices. Author(s)Ahmed Mohamed See AlsoOther Plotting methods: Examples
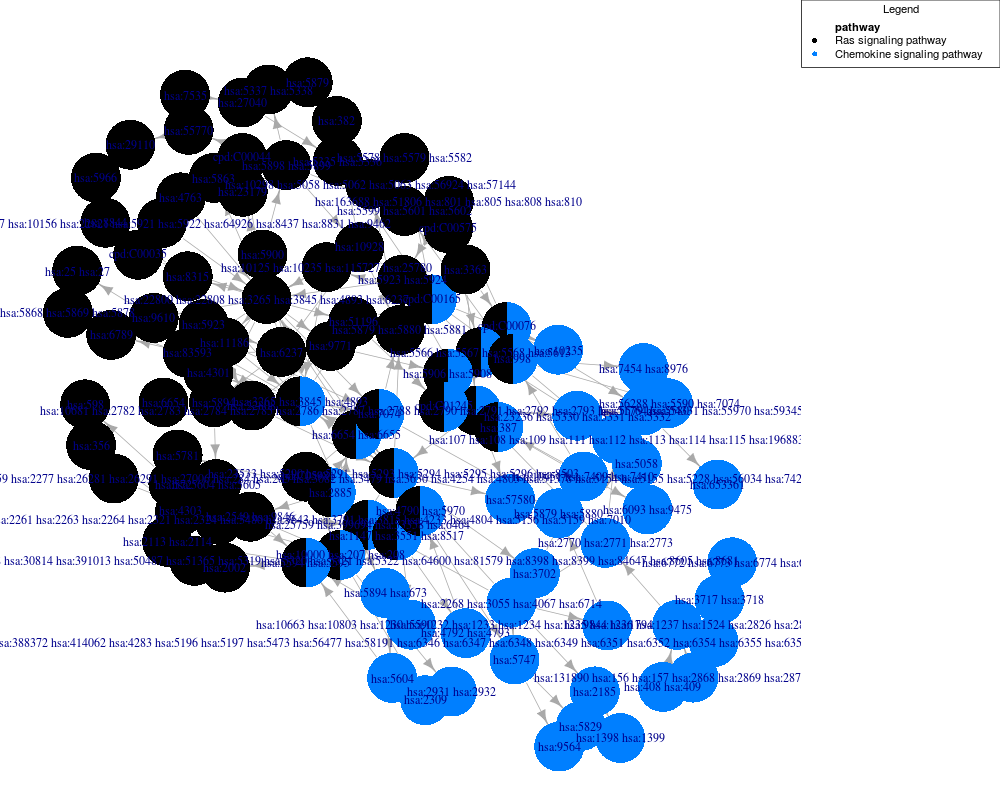
data("ex_kgml_sig")
v.layout <- layoutVertexByAttr(ex_kgml_sig, "pathway")
plotNetwork(ex_kgml_sig, vertex.color="pathway", layout=v.layout)
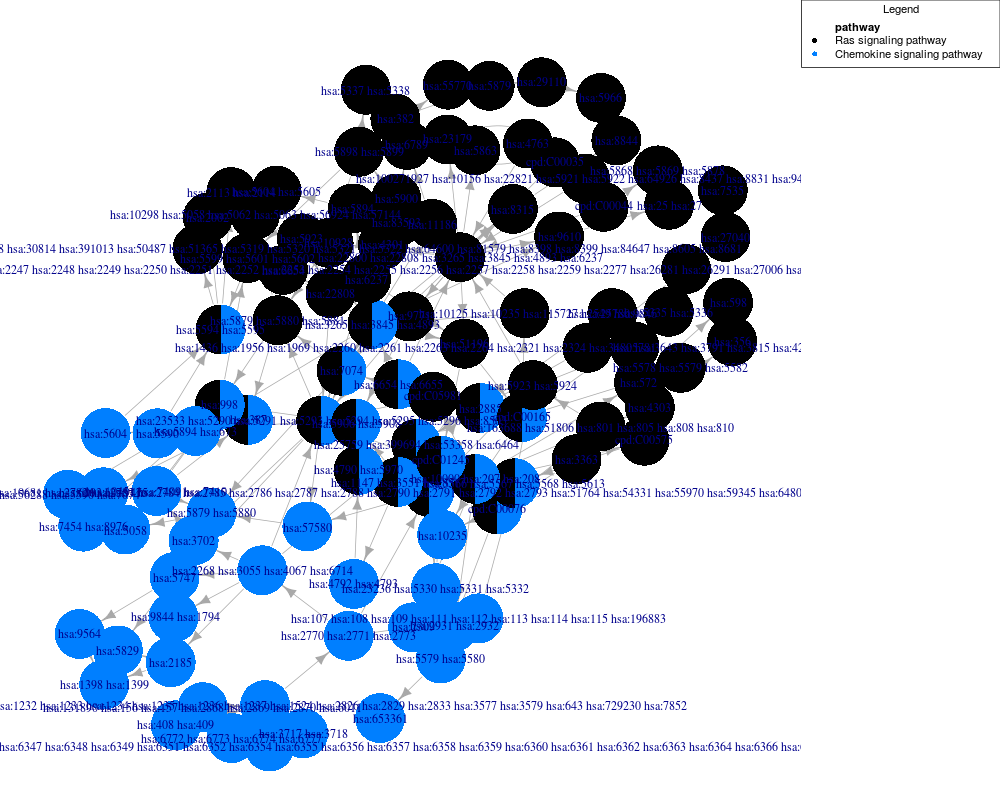
v.layout <- layoutVertexByAttr(ex_kgml_sig, "pathway", cluster.strength=5)
plotNetwork(ex_kgml_sig, vertex.color="pathway", layout=v.layout)
Results
R version 3.3.1 (2016-06-21) -- "Bug in Your Hair"
Copyright (C) 2016 The R Foundation for Statistical Computing
Platform: x86_64-pc-linux-gnu (64-bit)

R is free software and comes with ABSOLUTELY NO WARRANTY.
You are welcome to redistribute it under certain conditions.
Type 'license()' or 'licence()' for distribution details.

R is a collaborative project with many contributors.
Type 'contributors()' for more information and
'citation()' on how to cite R or R packages in publications.

Type 'demo()' for some demos, 'help()' for on-line help, or
'help.start()' for an HTML browser interface to help.
Type 'q()' to quit R.

> library(NetPathMiner)
Loading required package: igraph

Attaching package: 'igraph'

The following objects are masked from 'package:stats':

    decompose, spectrum

The following object is masked from 'package:base':

    union

> png(filename="/home/ddbj/snapshot/RGM3/R_BC/result/NetPathMiner/layoutVertexByAttr.Rd_%03d_medium.png", width=480, height=480)
> ### Name: layoutVertexByAttr
> ### Title: A graph layout function, which groups vertices by attribute.
> ### Aliases: layoutVertexByAttr
>
> ### ** Examples
>
> data("ex_kgml_sig")
>   v.layout <- layoutVertexByAttr(ex_kgml_sig, "pathway")
>   plotNetwork(ex_kgml_sig, vertex.color="pathway", layout=v.layout)
>
>   v.layout <- layoutVertexByAttr(ex_kgml_sig, "pathway", cluster.strength=5)
>   plotNetwork(ex_kgml_sig, vertex.color="pathway", layout=v.layout)
>
>
>
>
>
> dev.off()
null device
          1
>
|