Supported by Dr. Osamu Ogasawara and  . . |
|
Last data update: 2014.03.03 |
HME3M Markov pathway classifier.DescriptionHME3M Markov pathway classifier. UsagepathClassifier(paths, target.class, M, alpha = 1, lambda = 2, hme3miter = 100, plriter = 1, init = "random") Arguments
DetailsTake care with selection of lambda and alpha - make sure you check that the likelihood is always increasing. ValueA list with the following elements. A list with the following values
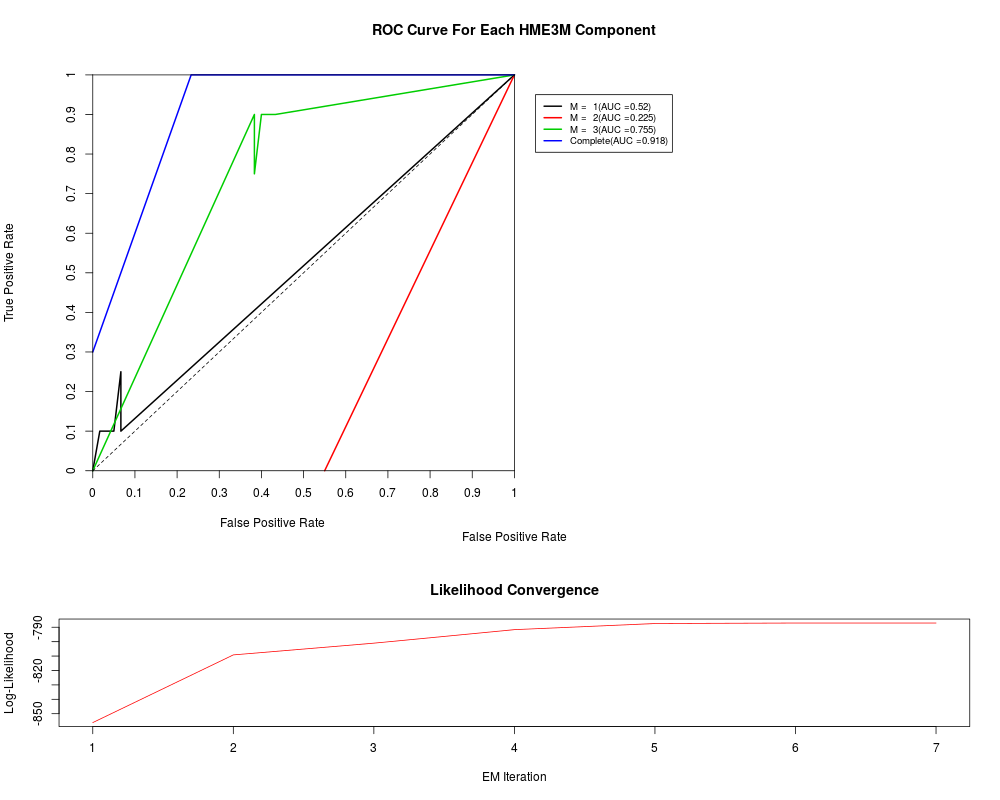
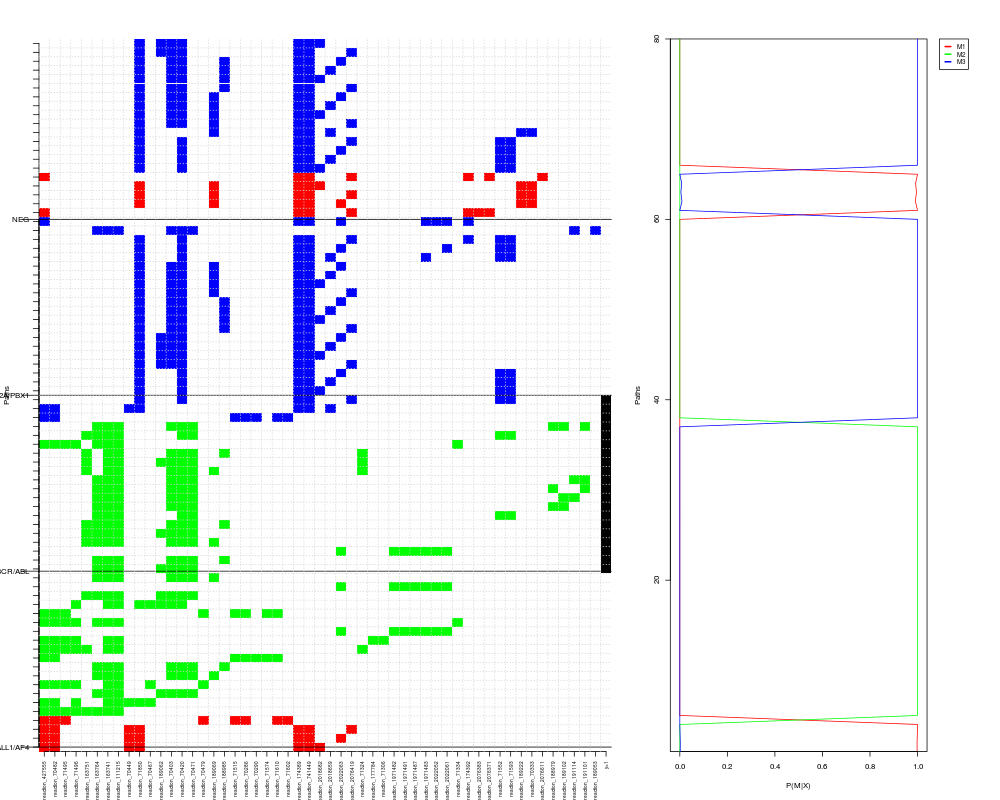
Author(s)Timothy Hancock and Ichigaku Takigawa ReferencesHancock, Timothy, and Mamitsuka, Hiroshi: A Markov Classification Model for Metabolic Pathways, Workshop on Algorithms in Bioinformatics (WABI) , 2009 Hancock, Timothy, and Mamitsuka, Hiroshi: A Markov Classification Model for Metabolic Pathways, Algorithms for Molecular Biology 2010 See AlsoOther Path clustering & classification methods: Examples## Prepare a weighted reaction network. ## Conver a metabolic network to a reaction network. data(ex_sbml) # bipartite metabolic network of Carbohydrate metabolism. rgraph <- makeReactionNetwork(ex_sbml, simplify=TRUE) ## Assign edge weights based on Affymetrix attributes and microarray dataset. # Calculate Pearson's correlation. data(ex_microarray) # Part of ALL dataset. rgraph <- assignEdgeWeights(microarray = ex_microarray, graph = rgraph, weight.method = "cor", use.attr="miriam.uniprot", y=factor(colnames(ex_microarray)), bootstrap = FALSE) ## Get ranked paths using probabilistic shortest paths. ranked.p <- pathRanker(rgraph, method="prob.shortest.path", K=20, minPathSize=6) ## Convert paths to binary matrix. ybinpaths <- pathsToBinary(ranked.p) p.class <- pathClassifier(ybinpaths, target.class = "BCR/ABL", M = 3) ## Contingency table of classification performance table(ybinpaths$y,p.class$label) ## Plotting the classifier results. plotClassifierROC(p.class) plotClusters(ybinpaths, p.class) Results
R version 3.3.1 (2016-06-21) -- "Bug in Your Hair"
Copyright (C) 2016 The R Foundation for Statistical Computing
Platform: x86_64-pc-linux-gnu (64-bit)

R is free software and comes with ABSOLUTELY NO WARRANTY.
You are welcome to redistribute it under certain conditions.
Type 'license()' or 'licence()' for distribution details.

R is a collaborative project with many contributors.
Type 'contributors()' for more information and
'citation()' on how to cite R or R packages in publications.

Type 'demo()' for some demos, 'help()' for on-line help, or
'help.start()' for an HTML browser interface to help.
Type 'q()' to quit R.

> library(NetPathMiner)
Loading required package: igraph

Attaching package: 'igraph'

The following objects are masked from 'package:stats':

    decompose, spectrum

The following object is masked from 'package:base':

    union

> png(filename="/home/ddbj/snapshot/RGM3/R_BC/result/NetPathMiner/pathClassifier.Rd_%03d_medium.png", width=480, height=480)
> ### Name: pathClassifier
> ### Title: HME3M Markov pathway classifier.
> ### Aliases: pathClassifier
>
> ### ** Examples
>
> ## Prepare a weighted reaction network.
> 	## Conver a metabolic network to a reaction network.
>  data(ex_sbml) # bipartite metabolic network of Carbohydrate metabolism.
>  rgraph <- makeReactionNetwork(ex_sbml, simplify=TRUE)
>
> 	## Assign edge weights based on Affymetrix attributes and microarray dataset.
>  # Calculate Pearson's correlation.
> 	data(ex_microarray)	# Part of ALL dataset.
> 	rgraph <- assignEdgeWeights(microarray = ex_microarray, graph = rgraph,
+ 		weight.method = "cor", use.attr="miriam.uniprot",
+ 		y=factor(colnames(ex_microarray)), bootstrap = FALSE)
100 genes were present in the microarray, but not represented in the network.
55 genes were couldn't be found in microarray.
Assigning edge weights for label ALL1/AF4
Assigning edge weights for label BCR/ABL
Assigning edge weights for label E2A/PBX1
Assigning edge weights for label NEG
>
> 	## Get ranked paths using probabilistic shortest paths.
>  ranked.p <- pathRanker(rgraph, method="prob.shortest.path",
+ 					K=20, minPathSize=6)
Extracting the 20 most probable paths for ALL1/AF4
Extracting the 20 most probable paths for BCR/ABL
Extracting the 20 most probable paths for E2A/PBX1
Extracting the 20 most probable paths for NEG
>
> 	## Convert paths to binary matrix.
> 	ybinpaths <- pathsToBinary(ranked.p)
> 	p.class <- pathClassifier(ybinpaths, target.class = "BCR/ABL", M = 3)
>
> 	## Contingency table of classification performance
> 	table(ybinpaths$y,p.class$label)

            0  1
  ALL1/AF4 20  0
  BCR/ABL  10 10
  E2A/PBX1 16  4
  NEG      20  0
>
> 	## Plotting the classifier results.
> 	plotClassifierROC(p.class)
> 	plotClusters(ybinpaths, p.class)
>
>
>
>
>
> dev.off()
null device
          1
>
|