Supported by Dr. Osamu Ogasawara and  . . |
|
Last data update: 2014.03.03 |
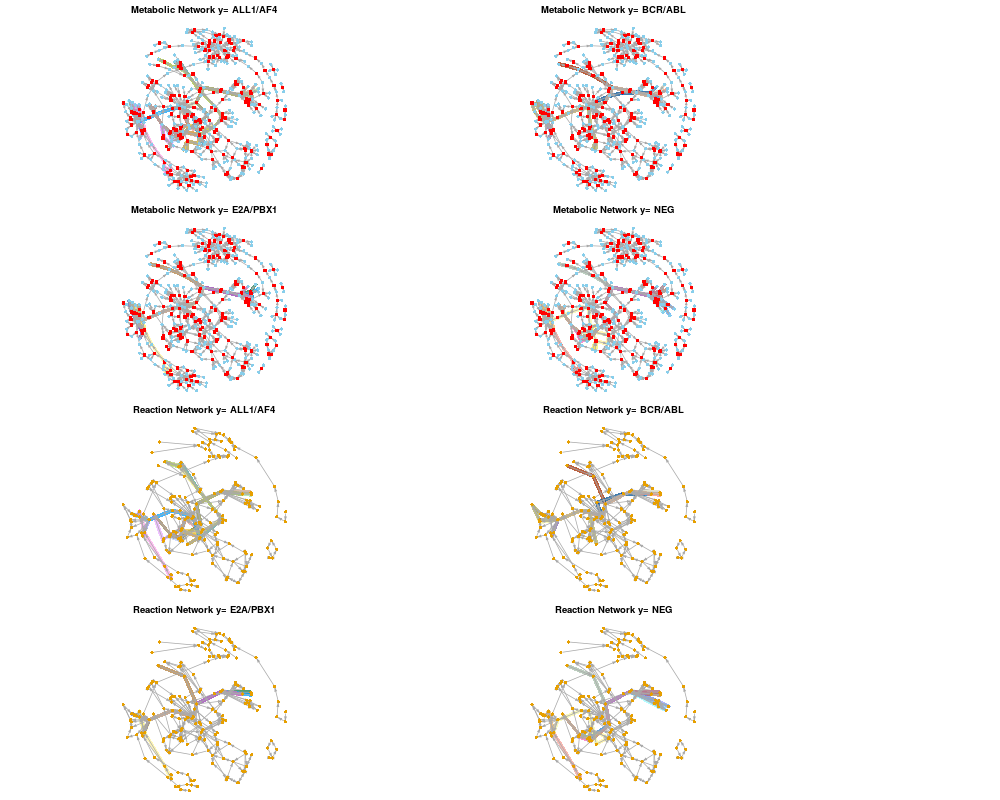
Higlighting ranked paths over multiple network representations.DescriptionThis function highlighting ranked paths over different network representations, metabolic, reaction and gene networks. The functions finds equivalent paths across different networks and marks them. UsageplotAllNetworks(paths, metabolic.net = NULL, reaction.net = NULL, gene.net = NULL, path.clusters = NULL, plot.clusters = TRUE, col.palette = palette(), layout = layout.auto, ...) Arguments
ValueHighlights the path list over all provided networks. Author(s)Ahmed Mohamed See AlsoOther Plotting methods: Examples## Prepare a weighted reaction network. ## Conver a metabolic network to a reaction network. data(ex_sbml) # bipartite metabolic network of Carbohydrate metabolism. rgraph <- makeReactionNetwork(ex_sbml, simplify=TRUE) ## Assign edge weights based on Affymetrix attributes and microarray dataset. # Calculate Pearson's correlation. data(ex_microarray) # Part of ALL dataset. rgraph <- assignEdgeWeights(microarray = ex_microarray, graph = rgraph, weight.method = "cor", use.attr="miriam.uniprot", y=factor(colnames(ex_microarray)), bootstrap = FALSE) ## Get ranked paths using probabilistic shortest paths. ranked.p <- pathRanker(rgraph, method="prob.shortest.path", K=20, minPathSize=6) plotAllNetworks(ranked.p, metabolic.net = ex_sbml, reaction.net = rgraph, vertex.label = "", vertex.size = 4) Results
R version 3.3.1 (2016-06-21) -- "Bug in Your Hair"
Copyright (C) 2016 The R Foundation for Statistical Computing
Platform: x86_64-pc-linux-gnu (64-bit)

R is free software and comes with ABSOLUTELY NO WARRANTY.
You are welcome to redistribute it under certain conditions.
Type 'license()' or 'licence()' for distribution details.

R is a collaborative project with many contributors.
Type 'contributors()' for more information and
'citation()' on how to cite R or R packages in publications.

Type 'demo()' for some demos, 'help()' for on-line help, or
'help.start()' for an HTML browser interface to help.
Type 'q()' to quit R.

> library(NetPathMiner)
Loading required package: igraph

Attaching package: 'igraph'

The following objects are masked from 'package:stats':

    decompose, spectrum

The following object is masked from 'package:base':

    union

> png(filename="/home/ddbj/snapshot/RGM3/R_BC/result/NetPathMiner/plotAllNetworks.Rd_%03d_medium.png", width=480, height=480)
> ### Name: plotAllNetworks
> ### Title: Higlighting ranked paths over multiple network representations.
> ### Aliases: plotAllNetworks
>
> ### ** Examples
>
> ## Prepare a weighted reaction network.
> 	## Conver a metabolic network to a reaction network.
>  data(ex_sbml) # bipartite metabolic network of Carbohydrate metabolism.
>  rgraph <- makeReactionNetwork(ex_sbml, simplify=TRUE)
>
> 	## Assign edge weights based on Affymetrix attributes and microarray dataset.
>  # Calculate Pearson's correlation.
> 	data(ex_microarray)	# Part of ALL dataset.
> 	rgraph <- assignEdgeWeights(microarray = ex_microarray, graph = rgraph,
+ 		weight.method = "cor", use.attr="miriam.uniprot",
+ 		y=factor(colnames(ex_microarray)), bootstrap = FALSE)
100 genes were present in the microarray, but not represented in the network.
55 genes were couldn't be found in microarray.
Assigning edge weights for label ALL1/AF4
Assigning edge weights for label BCR/ABL
Assigning edge weights for label E2A/PBX1
Assigning edge weights for label NEG
>
> 	## Get ranked paths using probabilistic shortest paths.
>  ranked.p <- pathRanker(rgraph, method="prob.shortest.path",
+ 					K=20, minPathSize=6)
Extracting the 20 most probable paths for ALL1/AF4
Extracting the 20 most probable paths for BCR/ABL
Extracting the 20 most probable paths for E2A/PBX1
Extracting the 20 most probable paths for NEG
>
> plotAllNetworks(ranked.p, metabolic.net = ex_sbml, reaction.net = rgraph,
+ 					vertex.label = "", vertex.size = 4)
>
>
>
>
>
> dev.off()
null device
          1
>
|