Plots the structure of specified path found by pathCluster.
Usage
plotPathCluster(ybinpaths, clusters, m, tol = NULL)
Arguments
ybinpaths
The training paths computed by pathsToBinary.
clusters
The pathway cluster model trained by pathCluster or pathClassifier.
m
The path cluster to view.
tol
A tolerance for 3M parameter theta which is the probability for
each edge within each cluster. If the tolerance is set all edges with a theta
below that tolerance will be removed from the plot.
Value
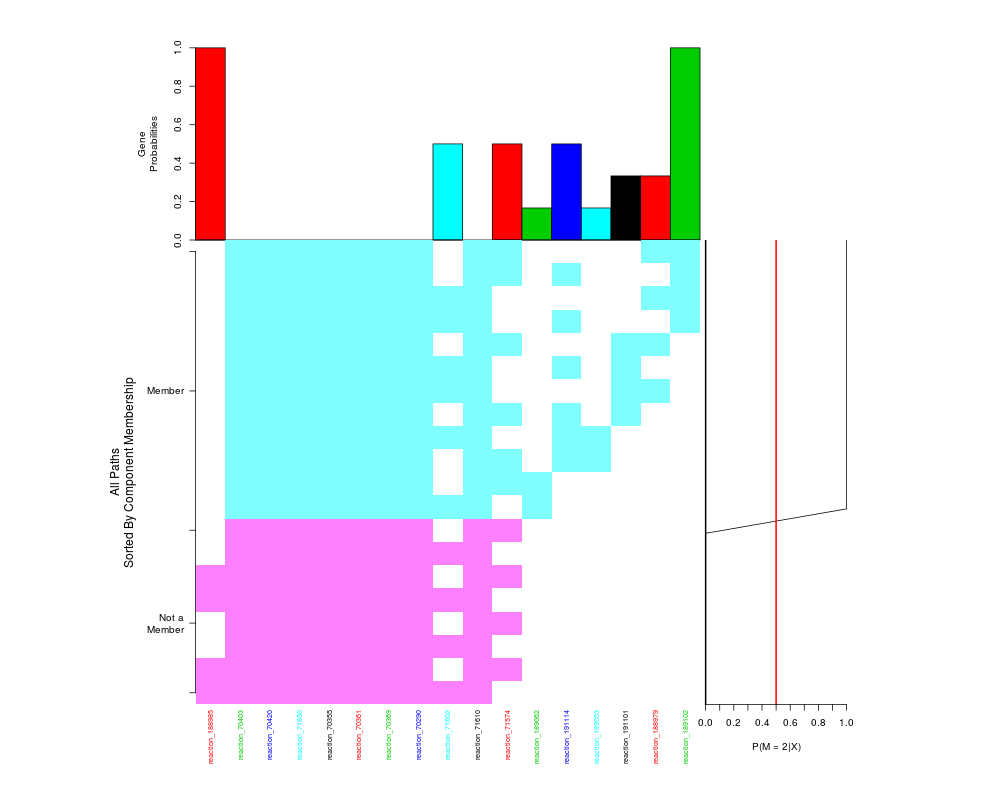
Produces a plot of the paths with the path probabilities and cluster membership probabilities.
Center Plot
An image of all paths the training dataset. Rows are the paths and columns are the genes
(features) included within each path.
Right
The training set posterior probabilities for each path belonging to the current 3M component.
Top Bar Plots
Theta, The 3M component probabilities - indicates the importance of each edge to a pathway.
## Prepare a weighted reaction network.
	## Conver a metabolic network to a reaction network.
 data(ex_sbml) # bipartite metabolic network of Carbohydrate metabolism.
 rgraph <- makeReactionNetwork(ex_sbml, simplify=TRUE)

	## Assign edge weights based on Affymetrix attributes and microarray dataset.
 # Calculate Pearson's correlation.
	data(ex_microarray)	# Part of ALL dataset.
	rgraph <- assignEdgeWeights(microarray = ex_microarray, graph = rgraph,
		weight.method = "cor", use.attr="miriam.uniprot", bootstrap = FALSE)

	## Get ranked paths using probabilistic shortest paths.
 ranked.p <- pathRanker(rgraph, method="prob.shortest.path",
					K=20, minPathSize=8)

	## Convert paths to binary matrix.
	ybinpaths <- pathsToBinary(ranked.p)
	p.cluster <- pathCluster(ybinpaths, M=2)
	plotPathCluster(ybinpaths, p.cluster, m=2, tol=0.05)
Results
R version 3.3.1 (2016-06-21) -- "Bug in Your Hair"
Copyright (C) 2016 The R Foundation for Statistical Computing
Platform: x86_64-pc-linux-gnu (64-bit)

R is free software and comes with ABSOLUTELY NO WARRANTY.
You are welcome to redistribute it under certain conditions.
Type 'license()' or 'licence()' for distribution details.

R is a collaborative project with many contributors.
Type 'contributors()' for more information and
'citation()' on how to cite R or R packages in publications.

Type 'demo()' for some demos, 'help()' for on-line help, or
'help.start()' for an HTML browser interface to help.
Type 'q()' to quit R.

> library(NetPathMiner)
Loading required package: igraph

Attaching package: 'igraph'

The following objects are masked from 'package:stats':

    decompose, spectrum

The following object is masked from 'package:base':

    union

> png(filename="/home/ddbj/snapshot/RGM3/R_BC/result/NetPathMiner/plotPathCluster.Rd_%03d_medium.png", width=480, height=480)
> ### Name: plotPathCluster
> ### Title: Plots the structure of specified path cluster
> ### Aliases: plotPathCluster
>
> ### ** Examples
>
> ## Prepare a weighted reaction network.
> 	## Conver a metabolic network to a reaction network.
>  data(ex_sbml) # bipartite metabolic network of Carbohydrate metabolism.
>  rgraph <- makeReactionNetwork(ex_sbml, simplify=TRUE)
>
> 	## Assign edge weights based on Affymetrix attributes and microarray dataset.
>  # Calculate Pearson's correlation.
> 	data(ex_microarray)	# Part of ALL dataset.
> 	rgraph <- assignEdgeWeights(microarray = ex_microarray, graph = rgraph,
+ 		weight.method = "cor", use.attr="miriam.uniprot", bootstrap = FALSE)
100 genes were present in the microarray, but not represented in the network.
55 genes were couldn't be found in microarray.
Assigning edge weights.
>
> 	## Get ranked paths using probabilistic shortest paths.
>  ranked.p <- pathRanker(rgraph, method="prob.shortest.path",
+ 					K=20, minPathSize=8)
Extracting the 20 most probable paths.
>
> 	## Convert paths to binary matrix.
> 	ybinpaths <- pathsToBinary(ranked.p)
> 	p.cluster <- pathCluster(ybinpaths, M=2)
> 	plotPathCluster(ybinpaths, p.cluster, m=2, tol=0.05)
>
>
>
>
>
> dev.off()
null device
          1
>
 .
.