Supported by Dr. Osamu Ogasawara and  . . |
|
Last data update: 2014.03.03 |
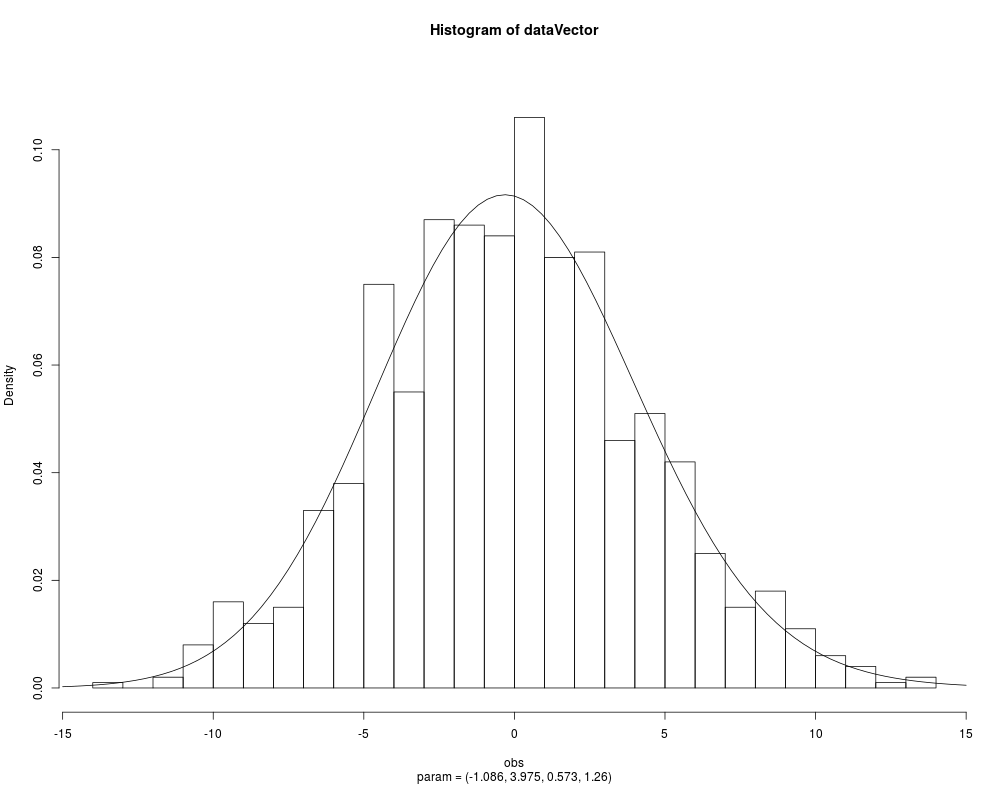
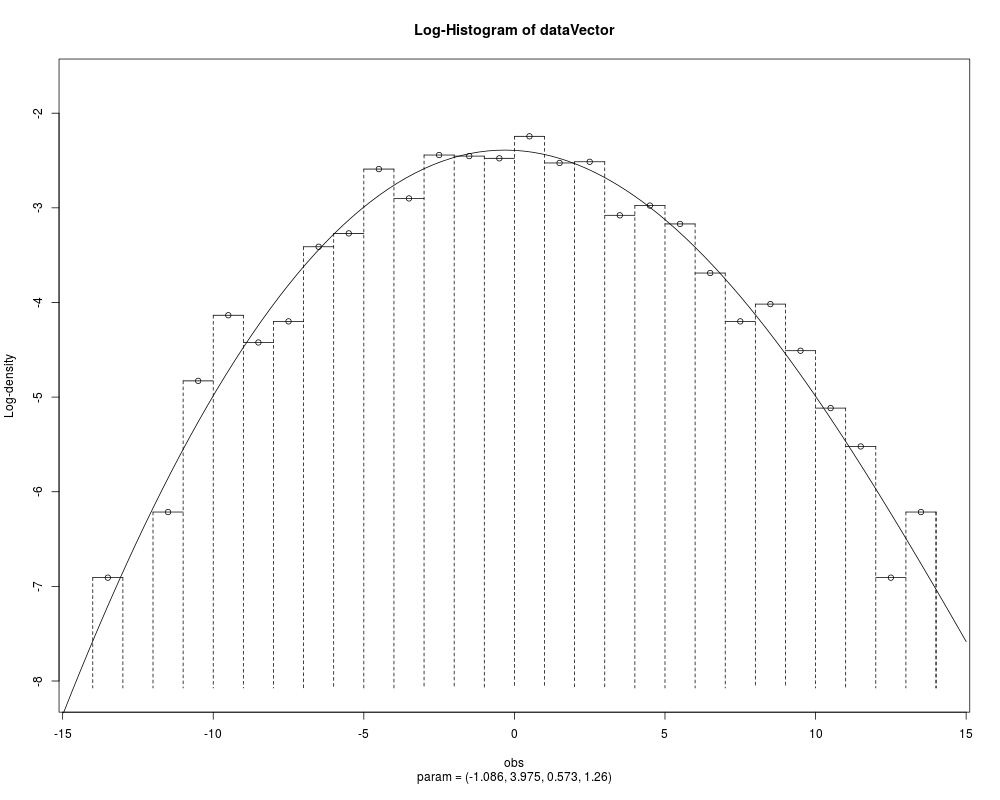
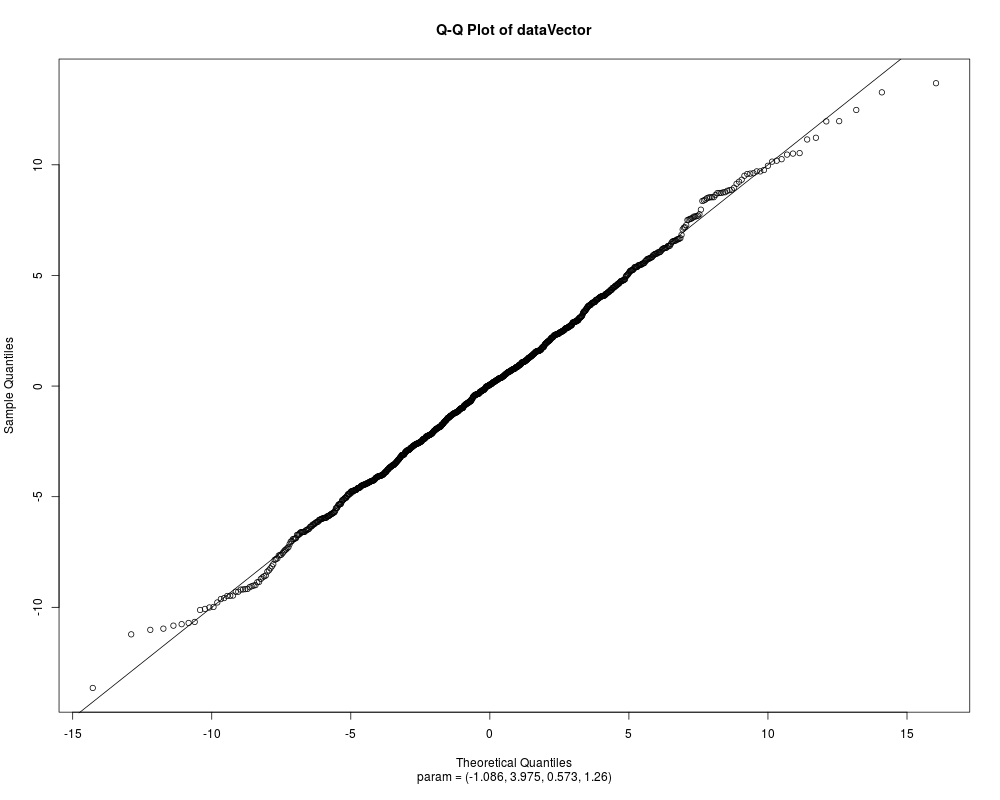
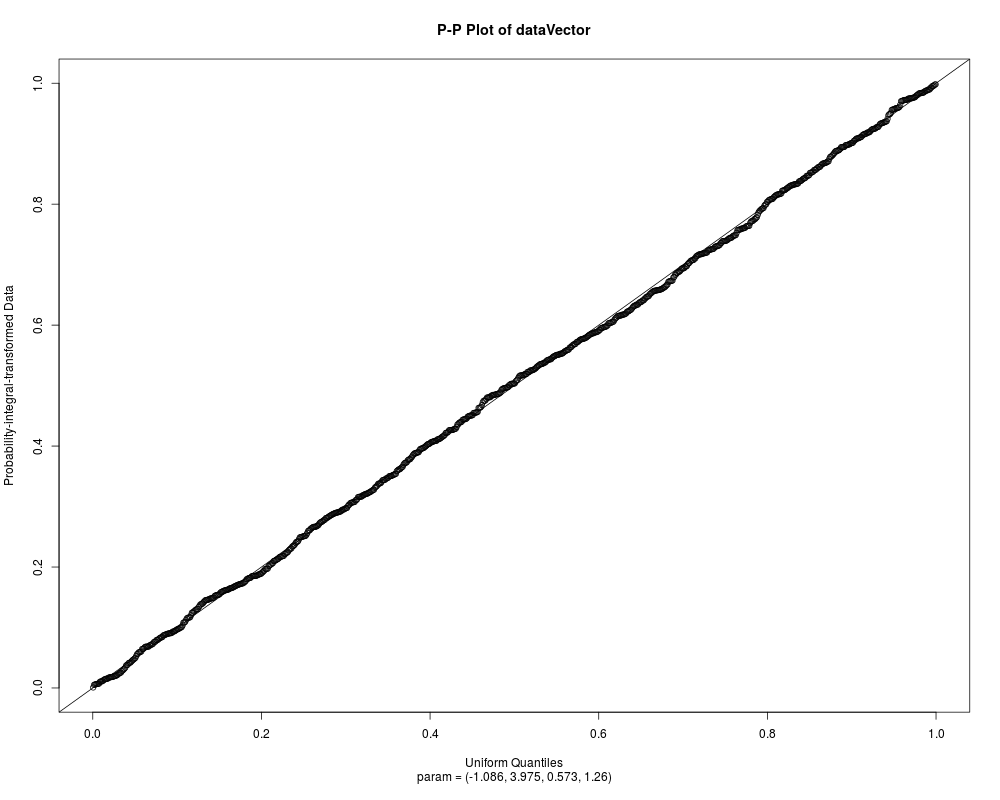
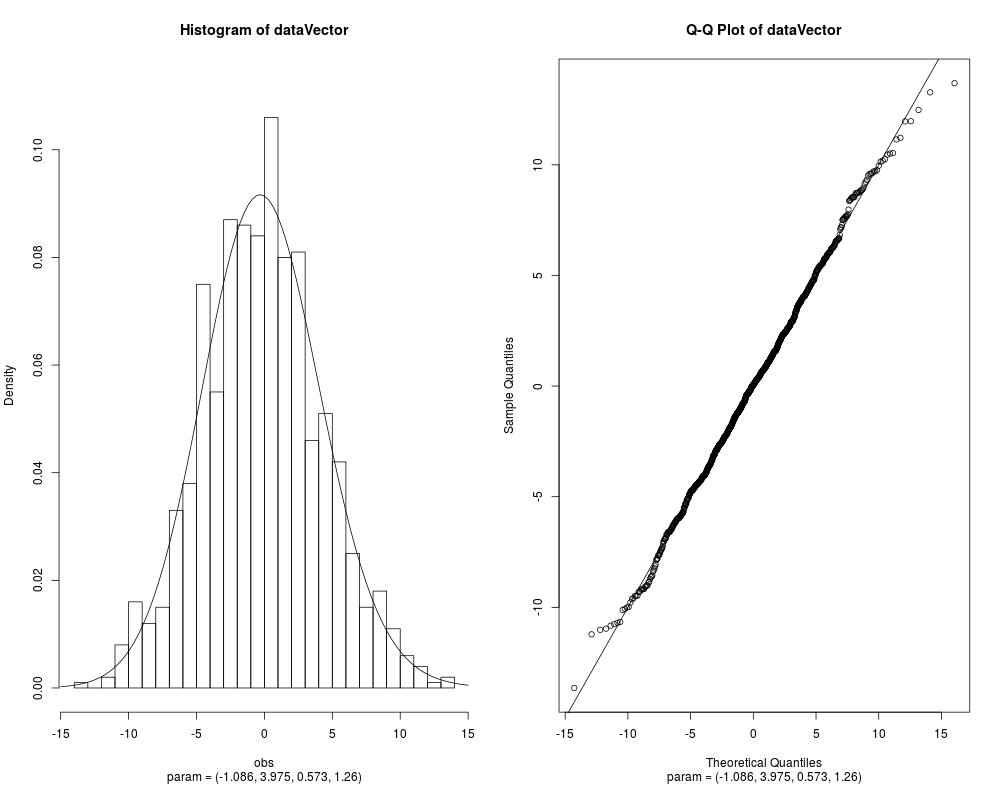
Fit the Normal Laplace Distribution to DataDescriptionFits a normal Laplace distribution to data. Displays the histogram, log-histogram (both with fitted densities), Q-Q plot and P-P plot for the fit which has the maximum likelihood. Usage
  nlFit(x, freq = NULL, breaks = "FD", paramStart = NULL,
        startMethod = "Nelder-Mead",
        startValues = c("MoM", "US"),
        method = c("Nelder-Mead", "BFGS", "L-BFGS-B",
                   "nlm", "nlminb"),
        hessian = FALSE,
        plots = FALSE, printOut = FALSE,
        controlBFGS = list(maxit = 200),
        controlLBFGSB = list(maxit = 200),
        controlNLMINB = list(),
        controlNM = list(maxit = 1000),
        maxitNLM = 1500, ...)
  ## S3 method for class 'nlFit'
print(x, digits = max(3, getOption("digits") - 3), ...)
  ## S3 method for class 'nlFit'
plot(x, which = 1:4,
    plotTitles = paste(c("Histogram of ","Log-Histogram of ",
                         "Q-Q Plot of ","P-P Plot of "), x$obsName,
                       sep = ""),
    ask = prod(par("mfcol")) < length(which) & dev.interactive(), ...)
  ## S3 method for class 'nlFit'
coef(object, ...)
  ## S3 method for class 'nlFit'
vcov(object, ...)
Arguments
Details
Three optimisation methods are available for use:
For details on how to pass control information for optimisation using
When ValueA list with components:
Author(s)David Scott d.scott@auckland.ac.nz, Simon Potter See Also
Examplesparam <- c(0, 2, 1, 1) dataVector <- rnl(1000, param = param) ## Let's see how well nlFit works nlFit(dataVector) nlFit(dataVector, plots = TRUE) fit <- nlFit(dataVector) par(mfrow = c(1, 2)) plot(fit, which = c(1, 3)) # See only histogram and Q-Q plot Results
R version 3.3.1 (2016-06-21) -- "Bug in Your Hair"
Copyright (C) 2016 The R Foundation for Statistical Computing
Platform: x86_64-pc-linux-gnu (64-bit)

R is free software and comes with ABSOLUTELY NO WARRANTY.
You are welcome to redistribute it under certain conditions.
Type 'license()' or 'licence()' for distribution details.

R is a collaborative project with many contributors.
Type 'contributors()' for more information and
'citation()' on how to cite R or R packages in publications.

Type 'demo()' for some demos, 'help()' for on-line help, or
'help.start()' for an HTML browser interface to help.
Type 'q()' to quit R.

> library(NormalLaplace)
Loading required package: DistributionUtils
Loading required package: RUnit
Loading required package: GeneralizedHyperbolic
> png(filename="/home/ddbj/snapshot/RGM3/R_CC/result/NormalLaplace/nlFit.Rd_%03d_medium.png", width=480, height=480)
> ### Name: nlFit
> ### Title: Fit the Normal Laplace Distribution to Data
> ### Aliases: nlFit print.nlFit plot.nlFit coef.nlFit vcov.nlFit
> ### Keywords: distribution
>
> ### ** Examples
>
> param <- c(0, 2, 1, 1)
> dataVector <- rnl(1000, param = param)
>
> ## Let's see how well nlFit works
> nlFit(dataVector)

Data:      dataVector
Parameter estimates:
     mu    sigma    alpha     beta
0.06784  4.12759  4.34682  4.06827
Likelihood:         2839.657
Method:             Nelder-Mead
Convergence code:   0
Iterations:         203
> nlFit(dataVector, plots = TRUE)

Data:      dataVector
Parameter estimates:
     mu    sigma    alpha     beta
0.06784  4.12759  4.34682  4.06827
Likelihood:         2839.657
Method:             Nelder-Mead
Convergence code:   0
Iterations:         203
> fit <- nlFit(dataVector)
> par(mfrow = c(1, 2))
> plot(fit, which = c(1, 3))  # See only histogram and Q-Q plot
>
>
>
>
>
> dev.off()
null device
          1
>
|