R: R function for plotting the predicted nucleosome positioning...
plotNuPoP
R Documentation
R function for plotting the predicted nucleosome positioning map and nucleosome occupancy map
Description
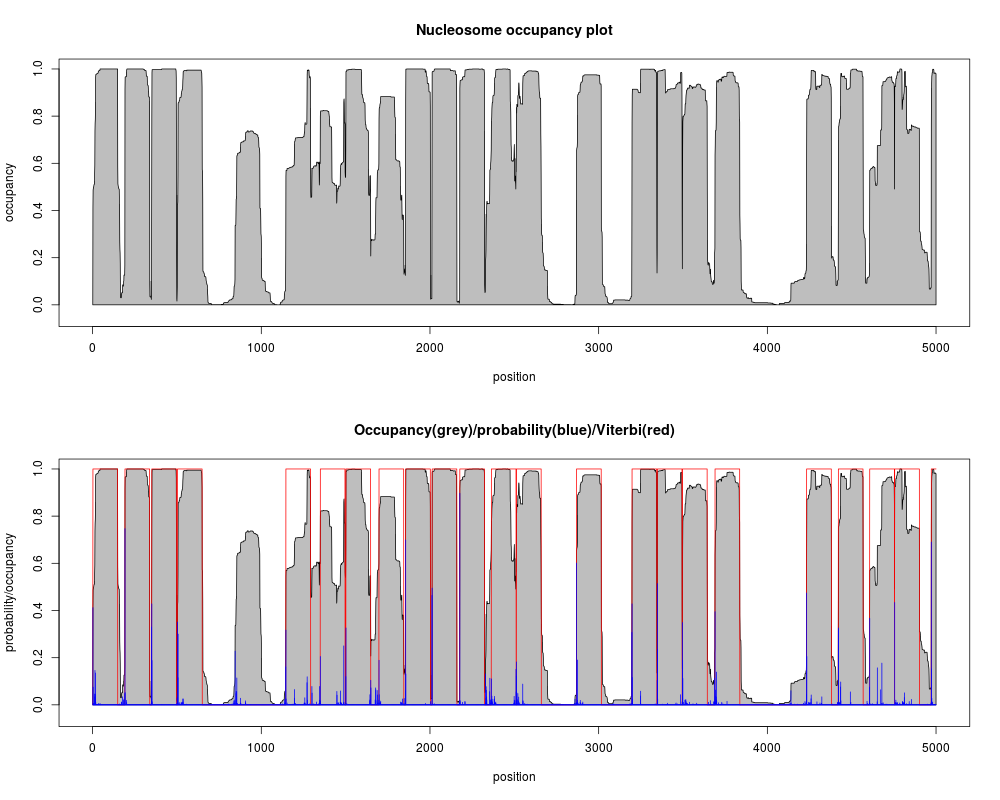
This function produces two plots from a specified region based on the prediction results from function predNuPoP. The first plot is the nucleosome occupancy (grey color). In the second plot, in addition to the occupancy, Viterbi prediction (red rectangle) and the posterior probability for a position to be the start of a nucleosome (blue color) are superimposed.
Usage
plotNuPoP(predNuPoPResults)
Arguments
predNuPoPResults
NuPoP prediction results from predNuPoP function. It must be a data frame read in by readNuPoP function.
Value
plotNuPoP outputs two plots: the nucleosome occupancy score map and Viterbi optimal nucleosome positioning map together with posterior probability for a position to be the start of a nucleosome.
Examples
library(NuPoP)

## the prediction results are stored in the current working directory
## the user should replace "system.file("extdata","test.seq_Prediction4.txt",package="NuPoP")"
## by the actual path and file name generated from prediction.
temp=readNuPoP(system.file("extdata","test.seq_Prediction4.txt",package="NuPoP"),startPos=1,endPos=5000)
plotNuPoP(temp)
Results
R version 3.3.1 (2016-06-21) -- "Bug in Your Hair"
Copyright (C) 2016 The R Foundation for Statistical Computing
Platform: x86_64-pc-linux-gnu (64-bit)

R is free software and comes with ABSOLUTELY NO WARRANTY.
You are welcome to redistribute it under certain conditions.
Type 'license()' or 'licence()' for distribution details.

R is a collaborative project with many contributors.
Type 'contributors()' for more information and
'citation()' on how to cite R or R packages in publications.

Type 'demo()' for some demos, 'help()' for on-line help, or
'help.start()' for an HTML browser interface to help.
Type 'q()' to quit R.

> library(NuPoP)
> png(filename="/home/ddbj/snapshot/RGM3/R_BC/result/NuPoP/plotNuPoP.Rd_%03d_medium.png", width=480, height=480)
> ### Name: plotNuPoP
> ### Title: R function for plotting the predicted nucleosome positioning map
> ###   and nucleosome occupancy map
> ### Aliases: plotNuPoP
>
> ### ** Examples
>
> library(NuPoP)
>
> ## the prediction results are stored in the current working directory
> ## the user should replace "system.file("extdata","test.seq_Prediction4.txt",package="NuPoP")"
> ## by the actual path and file name generated from prediction.
> temp=readNuPoP(system.file("extdata","test.seq_Prediction4.txt",package="NuPoP"),startPos=1,endPos=5000)
> plotNuPoP(temp)
>
>
>
>
>
> dev.off()
null device
          1
>
 .
.