Supported by Dr. Osamu Ogasawara and  . . |
|
Last data update: 2014.03.03 |
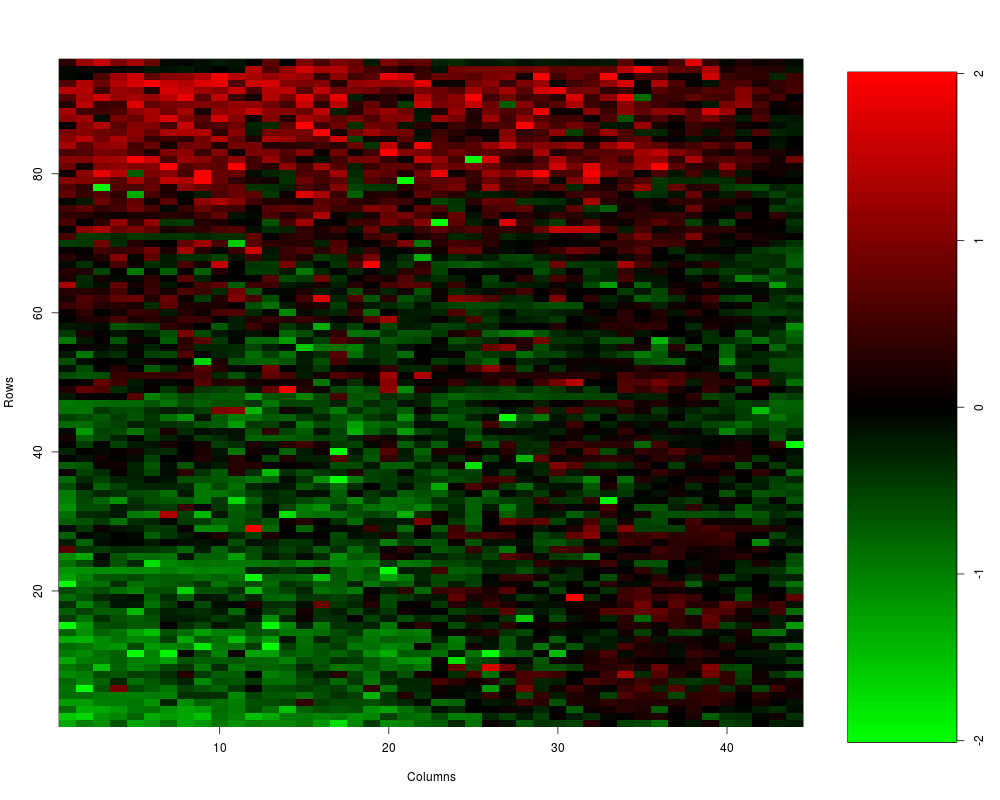
Generates a colour barDescriptionGenerates colour bar for MXY plots Usagecolorbar.mxy(color.lim,
col=c(rgb(0,(100:0)/100,0),rgb(0,0,0),rgb((1:100)/100,green=0,blue=0)),
ylab="",ylablim=FALSE)
Arguments
DetailsThe function Author(s)Matthias E. Futschik (http://itb.biologie.hu-berlin.de/~futschik) See Also
Examples
data(sw)

# GENERATING LAYOUT
mat <- matrix(1:2,ncol=2,nrow=1,byrow=TRUE)
l   <- layout(mat,widths=c(5,1))

# CHOOSING LIMITS OF COLOUR RANGE
color.lim <- c(-2,2)

# PLOTTING
Mtmp <- v2m(maM(sw)[,1],Ngc=maNgc(sw),Ngr=maNgr(sw),Nsc=maNsc(sw),Nsr=maNsr(sw),
               visu=TRUE,color.lim=color.lim)
colorbar.mxy(color.lim=color.lim,ylablim=FALSE,ylab="M")
Results
R version 3.3.1 (2016-06-21) -- "Bug in Your Hair"
Copyright (C) 2016 The R Foundation for Statistical Computing
Platform: x86_64-pc-linux-gnu (64-bit)

R is free software and comes with ABSOLUTELY NO WARRANTY.
You are welcome to redistribute it under certain conditions.
Type 'license()' or 'licence()' for distribution details.

R is a collaborative project with many contributors.
Type 'contributors()' for more information and
'citation()' on how to cite R or R packages in publications.

Type 'demo()' for some demos, 'help()' for on-line help, or
'help.start()' for an HTML browser interface to help.
Type 'q()' to quit R.

> library(OLIN)
Loading required package: locfit
locfit 1.5-9.1 	 2013-03-22
Loading required package: marray
Loading required package: limma
> png(filename="/home/ddbj/snapshot/RGM3/R_BC/result/OLIN/colorbar.mxy.Rd_%03d_medium.png", width=480, height=480)
> ### Name: colorbar.mxy
> ### Title: Generates a colour bar
> ### Aliases: colorbar.mxy
> ### Keywords: hplot
>
> ### ** Examples
>
>
> data(sw)
>
> # GENERATING LAYOUT
> mat <- matrix(1:2,ncol=2,nrow=1,byrow=TRUE)
> l   <- layout(mat,widths=c(5,1))
>
> # CHOOSING LIMITS OF COLOUR RANGE
> color.lim <- c(-2,2)
>
> # PLOTTING
> Mtmp <- v2m(maM(sw)[,1],Ngc=maNgc(sw),Ngr=maNgr(sw),Nsc=maNsc(sw),Nsr=maNsr(sw),
+                visu=TRUE,color.lim=color.lim)
> colorbar.mxy(color.lim=color.lim,ylablim=FALSE,ylab="M")
>
>
>
>
>
> dev.off()
null device
          1
>
|
Created & Maintained by Osamu Ogasawara (osamu.ogasawara@gmail.com) and 