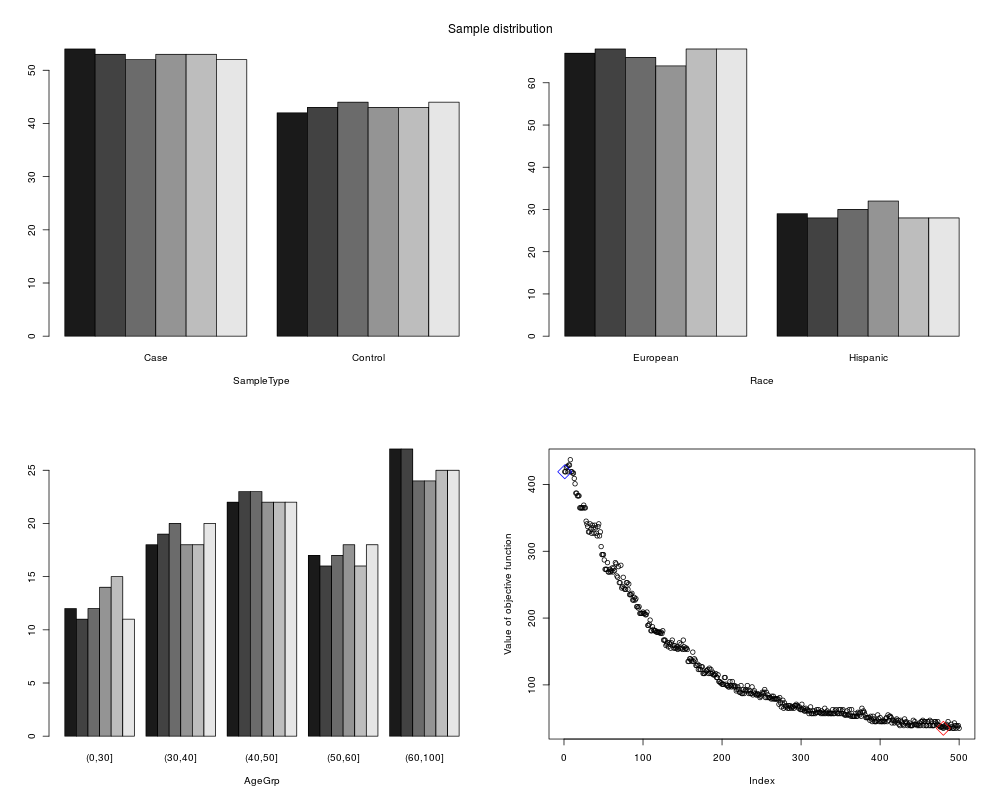
Provide a visual summary of the sample placement per plates, and
Chi-squre test of dependence between plates and other considered variables
from sample.
Usage
QC(object, main = NULL, ...)
Arguments
object
An object of class gExperimentSetup.
main
Mail title on the bar plot.
...
Additional plot parameters.
Examples
library("OSAT")
inPath <- system.file("extdata", package="OSAT")
pheno <- read.table(file.path(inPath, 'samples.txt'), header=TRUE, sep="\t")

## create object to hold sample information
gs <- setup.sample(pheno,  optimal=c("SampleType", "Race", "AgeGrp"), strata=c("SampleType") )
## create object that represents the used in the experiment
gc <- setup.container(IlluminaBeadChip96Plate, 6, batch='plates')
## create an optimized setup.
# demonstration only. nSim=5000 or more are commonly used.
gSetup <- create.optimized.setup(sample=gs, container=gc, nSim=500)
QC(gSetup)
Results
R version 3.3.1 (2016-06-21) -- "Bug in Your Hair"
Copyright (C) 2016 The R Foundation for Statistical Computing
Platform: x86_64-pc-linux-gnu (64-bit)

R is free software and comes with ABSOLUTELY NO WARRANTY.
You are welcome to redistribute it under certain conditions.
Type 'license()' or 'licence()' for distribution details.

R is a collaborative project with many contributors.
Type 'contributors()' for more information and
'citation()' on how to cite R or R packages in publications.

Type 'demo()' for some demos, 'help()' for on-line help, or
'help.start()' for an HTML browser interface to help.
Type 'q()' to quit R.

> library(OSAT)
> png(filename="/home/ddbj/snapshot/RGM3/R_BC/result/OSAT/QC.Rd_%03d_medium.png", width=480, height=480)
> ### Name: QC
> ### Title: QC
> ### Aliases: QC
>
> ### ** Examples
>
> library("OSAT")
> inPath <- system.file("extdata", package="OSAT")
> pheno <- read.table(file.path(inPath, 'samples.txt'), header=TRUE, sep="\t")
>
> ## create object to hold sample information
> gs <- setup.sample(pheno,  optimal=c("SampleType", "Race", "AgeGrp"), strata=c("SampleType") )
> ## create object that represents the used in the experiment
> gc <- setup.container(IlluminaBeadChip96Plate, 6, batch='plates')
> ## create an optimized setup.
> # demonstration only. nSim=5000 or more are commonly used.
> gSetup <- create.optimized.setup(sample=gs, container=gc, nSim=500)
Warning message:
In create.optimized.setup(sample = gs, container = gc, nSim = 500) :
  Using default optimization method: optimal.shuffle
> QC(gSetup)

Test independence between "plates" and sample variables


Pearson's Chi-squared test

         Var X-squared df   p.value
1 SampleType 0.6243864  5 0.9868595
2       Race 0.3365301  5 0.9968991
3     AgeGrp 3.0414260 20 0.9999954


>
>
>
>
>
> dev.off()
null device
          1
>
 .
.