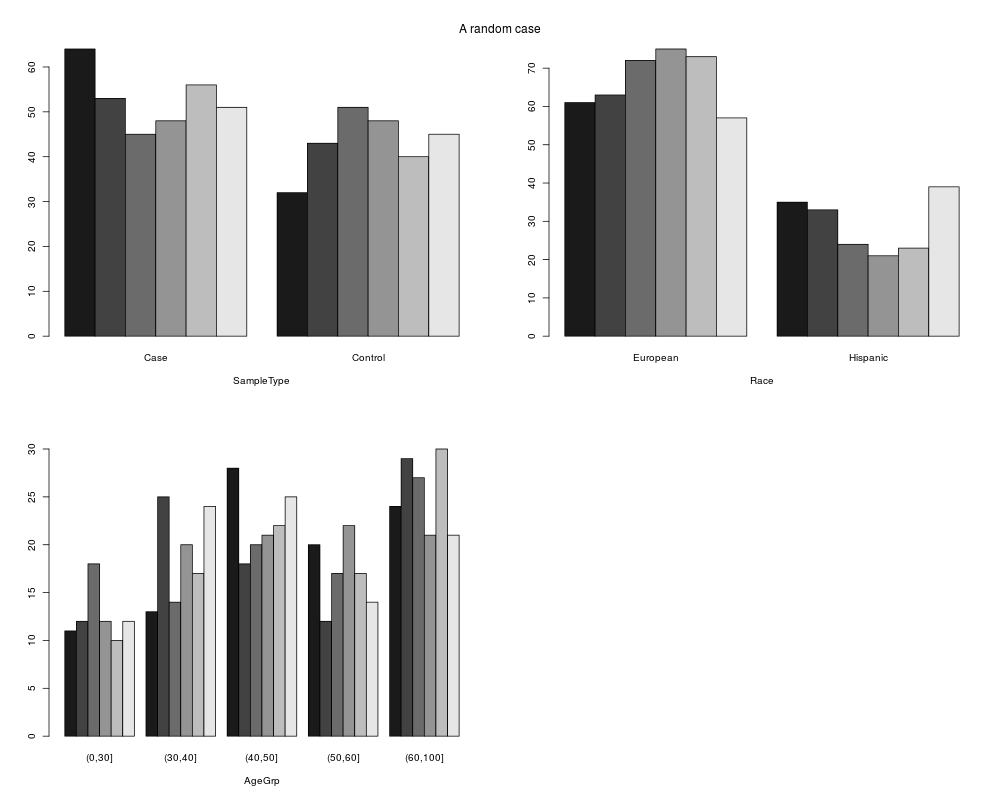
Plot multiple bar plots based on a single data frame.
Usage
multi.barplot(x, grpVar = "plates", varList, main = NULL, ...)
Arguments
x
A data frame.
grpVar
The variable for x-axix.
varList
A vector of variables, each will be used as y-axis for
the multiple bar plot.
main
The overall title of the plot.
...
Additinal parameters for the plot function.
Value
Use the side effect for plot. No return value.
Examples
## create a random assignment and check it
library("OSAT")
data(example.setup)
set.seed(10)
c1 <- getLayout(gc)                 # available wells
c1 <- c1[order(runif(nrow(c1))),]   # shuffle randomly
ranomSetup <- cbind(pheno, c1[1:nrow(pheno), ]) # create a sample assignment

multi.barplot(ranomSetup, grpVar='plates', varList=c("SampleType", "Race", "AgeGrp"), main="A random case")
Results
R version 3.3.1 (2016-06-21) -- "Bug in Your Hair"
Copyright (C) 2016 The R Foundation for Statistical Computing
Platform: x86_64-pc-linux-gnu (64-bit)

R is free software and comes with ABSOLUTELY NO WARRANTY.
You are welcome to redistribute it under certain conditions.
Type 'license()' or 'licence()' for distribution details.

R is a collaborative project with many contributors.
Type 'contributors()' for more information and
'citation()' on how to cite R or R packages in publications.

Type 'demo()' for some demos, 'help()' for on-line help, or
'help.start()' for an HTML browser interface to help.
Type 'q()' to quit R.

> library(OSAT)
> png(filename="/home/ddbj/snapshot/RGM3/R_BC/result/OSAT/multi.barplot.Rd_%03d_medium.png", width=480, height=480)
> ### Name: multi.barplot
> ### Title: multi.barplot
> ### Aliases: multi.barplot
>
> ### ** Examples
>
> ## create a random assignment and check it
> library("OSAT")
> data(example.setup)
> set.seed(10)
> c1 <- getLayout(gc)                 # available wells
> c1 <- c1[order(runif(nrow(c1))),]   # shuffle randomly
> ranomSetup <- cbind(pheno, c1[1:nrow(pheno), ]) # create a sample assignment
>
> multi.barplot(ranomSetup, grpVar='plates', varList=c("SampleType", "Race", "AgeGrp"), main="A random case")
>
>
>
>
>
> dev.off()
null device
          1
>
 .
.