Supported by Dr. Osamu Ogasawara and  . . |
|
Last data update: 2014.03.03 |
Functions for remapping, changing the resolution, and extracting from 2-D or 3-D data.DescriptionS3 functions Function S3-functions
Usage
remap        (var, ...)

## S3 method for class 'matrix'
remap(var, x, y, xto = NULL, yto = NULL,
          na.rm = TRUE, ...)

## S3 method for class 'array'
remap(var, x, y, z, xto = NULL, yto = NULL, zto = NULL,
          na.rm = TRUE, ...)

changeres    (var, ...)

## S3 method for class 'matrix'
changeres(var, x, y, resfac, na.rm = TRUE, ...)

## S3 method for class 'array'
changeres(var, x, y, z, resfac, na.rm = TRUE, ...)

extract    (var, ...)

## S3 method for class 'matrix'
extract(var, x, y, xyto, ...)

## S3 method for class 'array'
extract(var, x, y, z, xyzto, ...)

transect(var, x, y, z, to, margin = "xy", ...)

mapsigma   (var, ...)

## S3 method for class 'matrix'
mapsigma(var = NULL, sigma, signr = 2, x = NULL,
    depth = NULL, numdepth = NULL, xto = NULL, resfac = 1, ...)

## S3 method for class 'array'
mapsigma(var = NULL, sigma, signr = 3, x = NULL, y = NULL,
    depth = NULL, numdepth = NULL, xto = NULL, yto = NULL,
    resfac = 1, ...)

transectsigma(var = NULL, sigma, x, y, to, depth = NULL,
                numdepth = NULL, resfac = 1, ...)
Arguments
DetailsS3-function S3-function S3-function
Value
See AlsoSylt3D for other examples of mapping. Examples
# save plotting parameters
pm <- par("mfrow")
## =======================================================================
## Simple examples
## =======================================================================
M <- matrix(nrow = 2, data = 1:4)
remap(M, x = 1:2, y = 1:2,
xto = seq(1, 2, length.out = 3), yto = 1:2)
changeres(M, x = 1:2, y = 1:2, resfac = c(2, 1))
changeres(M, x = 1:2, y = 1:2, resfac = 2)
# x and or y are a matrix.
changeres(var = M, x = M, y = 1:2, resfac = c(2, 1))
changeres(M, x = M, y = 1:2, resfac = 2)
## =======================================================================
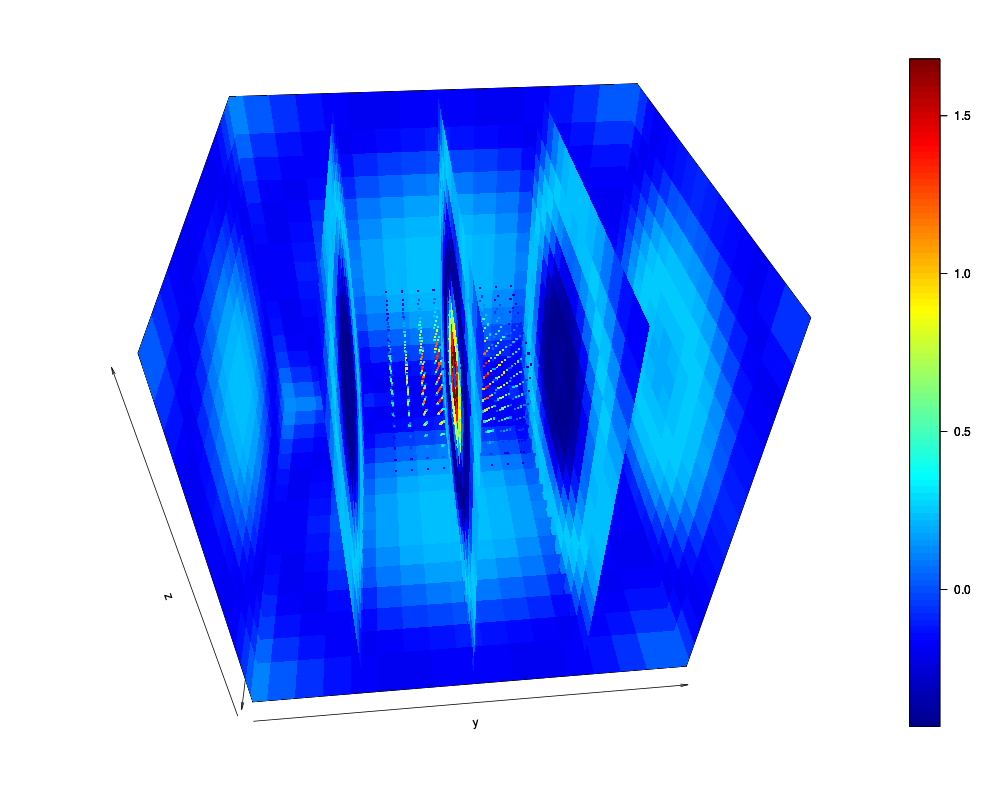
## Use remap to add more detail to a slice3D plot
## =======================================================================
par(mfrow = c(1, 1))
x <- y <- z <- seq(-4, 4, by = 0.5)
M <- mesh(x, y, z)
R <- with (M, sqrt(x^2 + y^2 + z^2))
p <- sin(2*R) /(R+1e-3)
slice3D(x, y, z, ys = seq(-4, 4, by = 2), theta = 85,
colvar = p, pch = ".", clim = range(p))
xto <- yto <- zto <- seq(-1.2, 1.2, 0.3)
Res <- remap (p, x, y, z, xto, yto, zto)
# expand grid for scatterplot
Mt <- mesh(Res$x, Res$y, Res$z)
scatter3D(x = Mt$x, y = Mt$y, z = Mt$z, colvar = Res$var,
pch = ".", add = TRUE, cex = 3, clim = range(p))
# same in rgl:
## Not run:
plotrgl()
## End(Not run)
# extract specific values from 3-D data
xyzto <- matrix(nrow = 2, data = c(1, 1, 1, 2, 2, 2), byrow = TRUE)
extract(var = p, x, y, z, xyzto = xyzto)
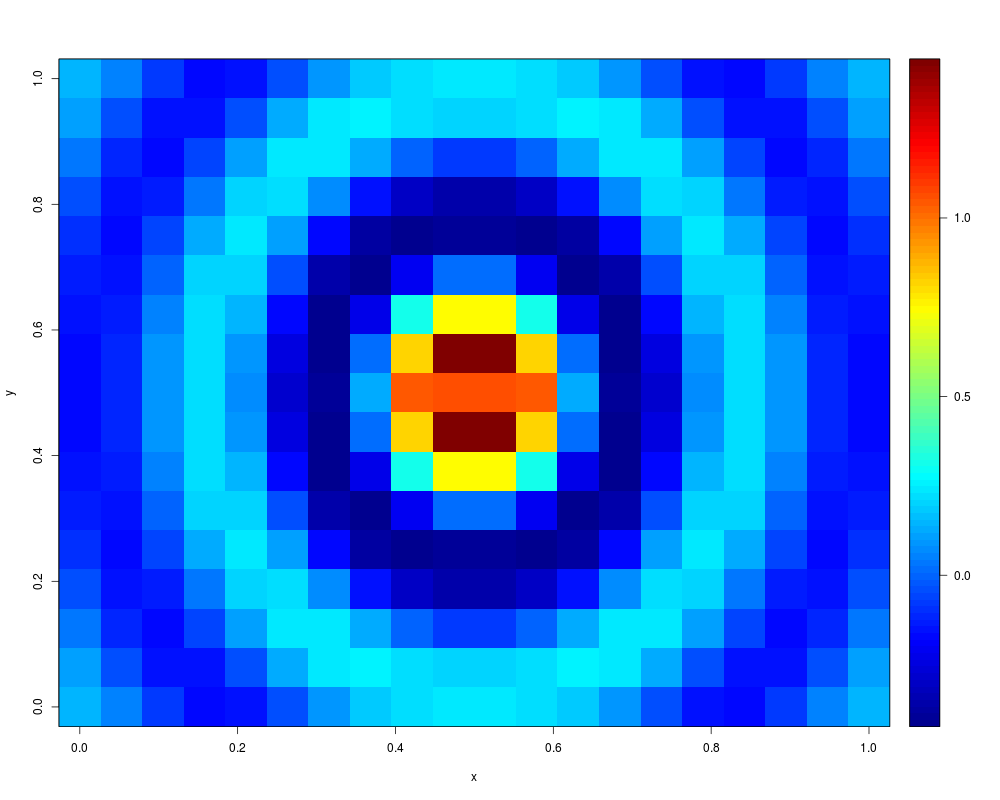
# a transect
to <- cbind(seq(-4, 4, length.out = 20), seq(-4, 4, length.out = 20))
image2D( transect(p, x, y, z, to = to)$var)
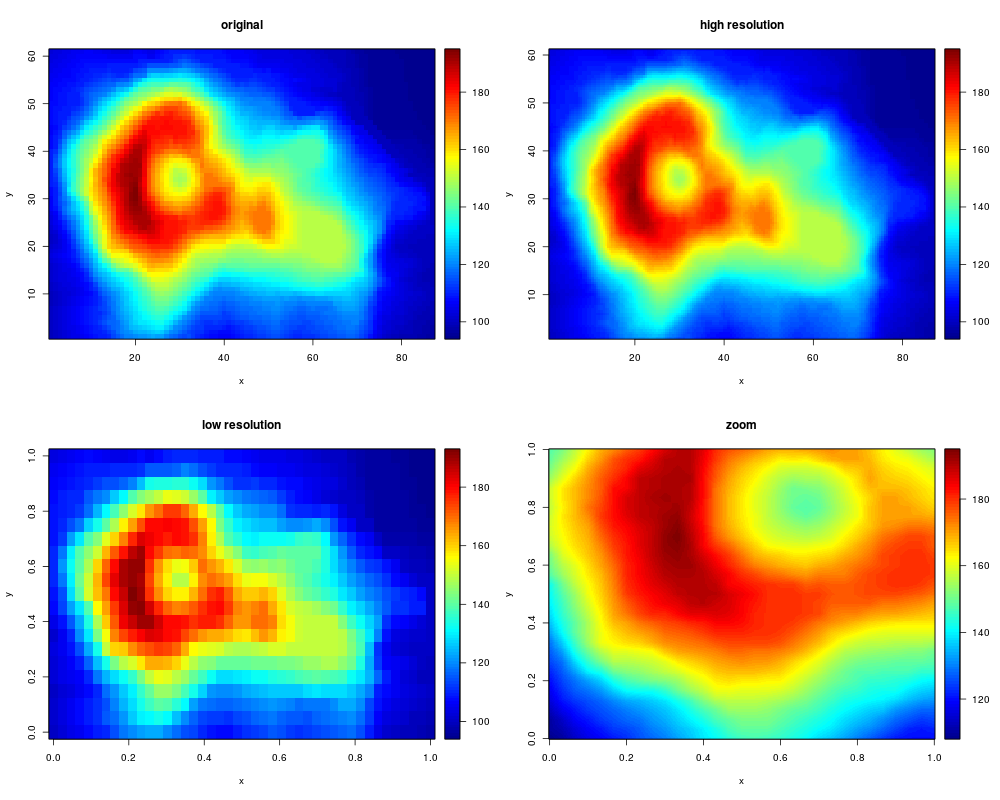
## =======================================================================
## change the resolution of a 2-D image
## =======================================================================
par(mfrow = c(2, 2))
nr <- nrow(volcano)
nc <- ncol(volcano)
x <- 1 : nr
y <- 1 : nc
image2D(x = x, y = y, volcano, main = "original")
# increasing the resolution
x2 <- seq(from = 1, to = nr, by = 0.5)
y2 <- seq(from = 1, to = nc, by = 0.5)
VOLC1 <- remap(volcano, x = x, y = y, xto = x2, yto = y2)$var
image2D(x = x2, y = y2, z = VOLC1, main = "high resolution")
# low resolution
xb <- seq(from = 1, to = nr, by = 2)
yb <- seq(from = 1, to = nc, by = 3)
VOLC2 <- remap(volcano, x, y, xb, yb)$var
image2D(VOLC2, main = "low resolution")
# zooming in high resolution
xc <- seq(10, 40, 0.1)
yc <- seq(10, 40, 0.1)
VOLC3 <- remap(volcano,x, y, xc, yc)$var
image2D(VOLC3, main = "zoom")
# Get one value or a grid of values
remap(volcano, x, y, xto = 2.5, yto = 5)
remap(volcano, x, y, xto = c(2, 5), yto = c(5, 10))
# Specific values
extract(volcano, x, y, xyto = cbind(c(2, 5), c(5, 10)))
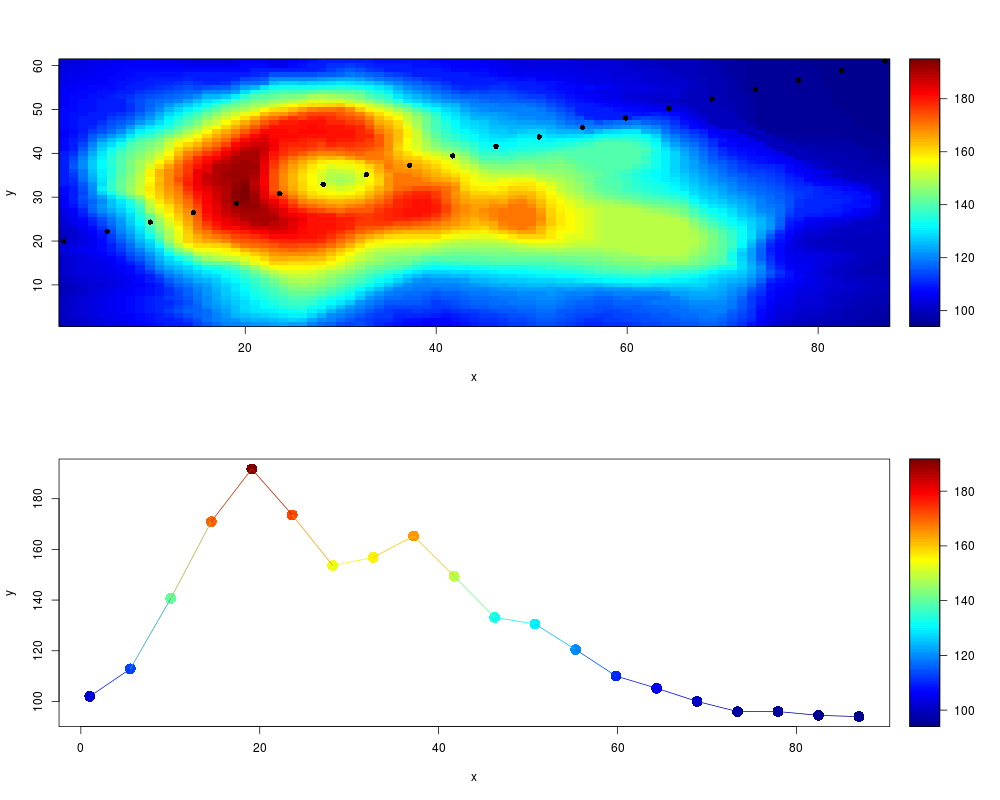
## =======================================================================
## take a cross section or transect of volcano
## =======================================================================
par(mfrow = c(2, 1))
image2D(volcano, x = 1:nr, y = 1:nc)
xyto <- cbind(seq(from = 1, to = nr, length.out = 20),
seq(from = 20, to = nc, length.out = 20))
points(xyto[,1], xyto[,2], pch = 16)
(Crossection <- extract (volcano, x = 1:nr, y = 1:nc,
xyto = xyto))
scatter2D(xyto[, 1], Crossection$var, colvar = Crossection$var,
type = "b", cex = 2, pch = 16)
## =======================================================================
## mapsigma: changing from sigma coordinates into depth-coordinates
## =======================================================================
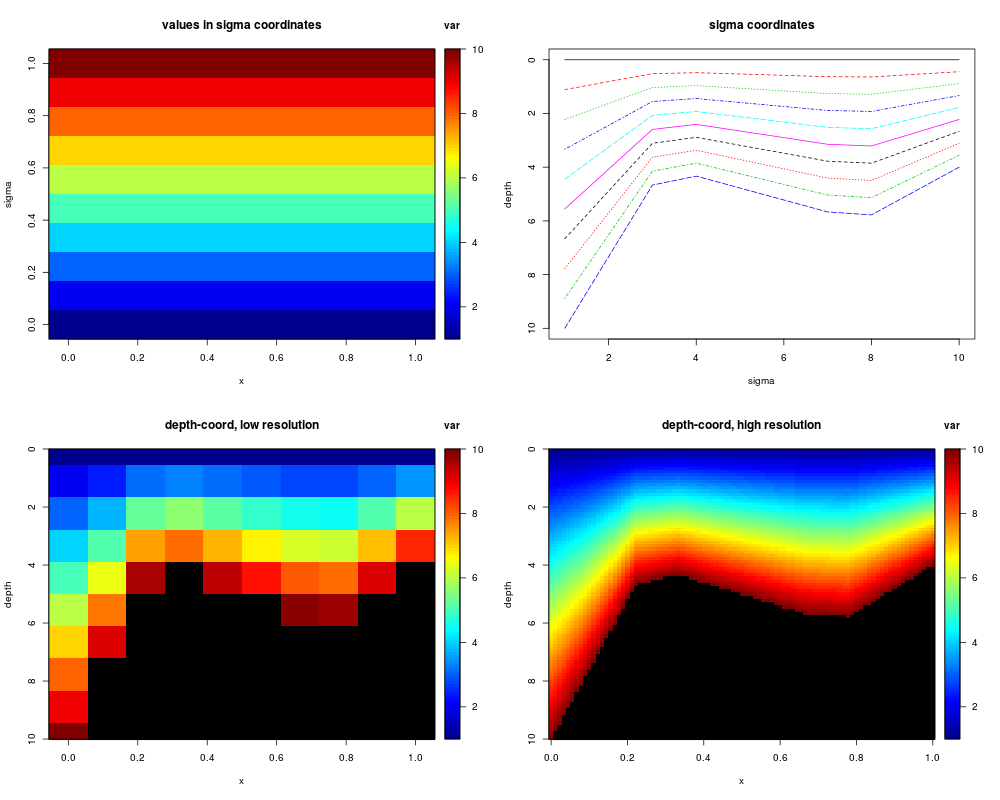
par(mfrow = c(2, 2))
var <- t(matrix (nrow = 10, ncol = 10, data = 1:10))
image2D(var, ylab = "sigma", main = "values in sigma coordinates",
clab = "var")
# The depth at each 'column'
Depth <- approx(x = 1:5, y = c(10, 4, 5, 6, 4),
xout = seq(1,5, length.out = 10))$y
# Sigma coordinates
sigma <- t(matrix(nrow = 10, ncol = 10, data = Depth, byrow = TRUE) *
seq(from = 0, to = 1, length = 10))
matplot(sigma, type = "l", main = "sigma coordinates",
xlab = "sigma", ylab = "depth", ylim = c(10, 0))
# Mapping to the default depth coordinates
varz <- mapsigma(var = var, sigma = sigma)
image2D(varz$var, y = varz$depth, NAcol = "black", ylim = c(10, 0),
clab = "var", ylab = "depth",
main = "depth-coord, low resolution")
# Mapping at higher resolution of depth coordinates
varz <- mapsigma(var, sigma = sigma, resfac = 10)
image2D(varz$var, y = varz$depth, NAcol = "black", ylim = c(10, 0),
clab = "var", ylab = "depth",
main = "depth-coord, high resolution")
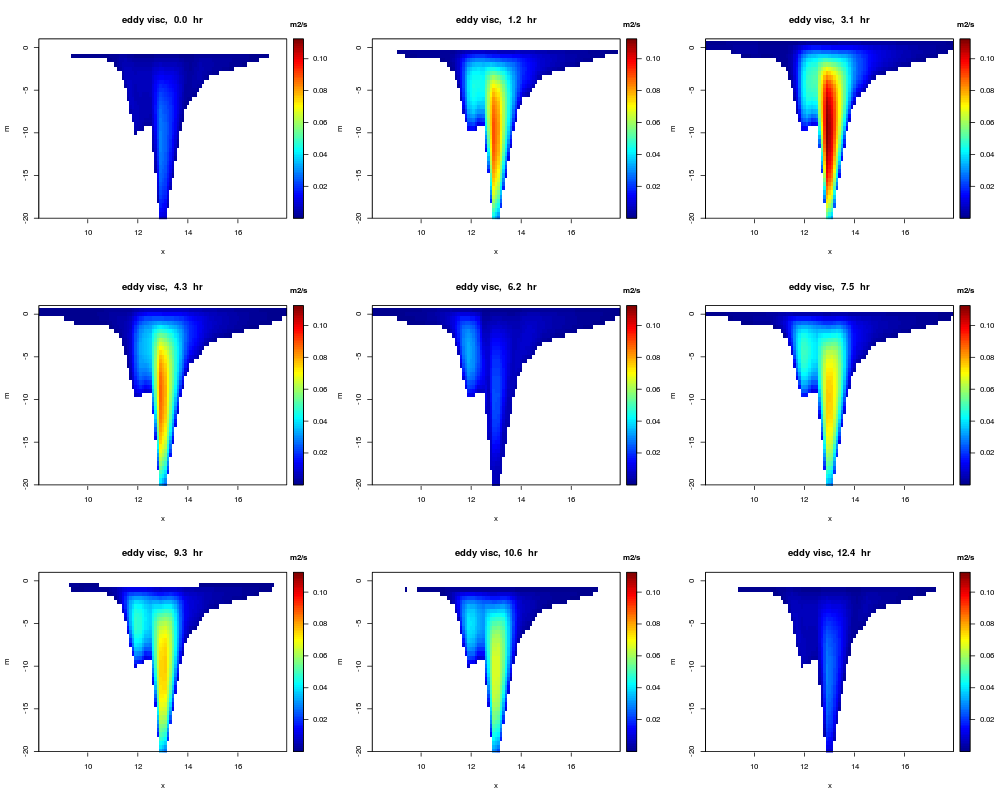
## =======================================================================
## mapsigma: mapping to depth for data Sylttran (x, sigma, time)
## =======================================================================
# depth values
D <- seq(-1, 20, by = 0.5)
dim(Sylttran$visc)
# sigma coordinates are the second dimension (signr)
# resolution is increased for 'x' and decreased for 'time'
visc <- mapsigma(Sylttran$visc, x = Sylttran$x, y = Sylttran$time,
sigma = Sylttran$sigma, signr = 2, depth = D, resfac = c(2, 1, 0.4))
# changed dimensions
dim(visc$var)
image2D(visc$var, x = visc$x, y = -visc$depth, ylim = c(-20, 1),
main = paste("eddy visc,", format(visc$y, digits = 2), " hr"),
ylab = "m", xlab = "x", clab = c("","m2/s"),
clim = range(visc$var, na.rm = TRUE))
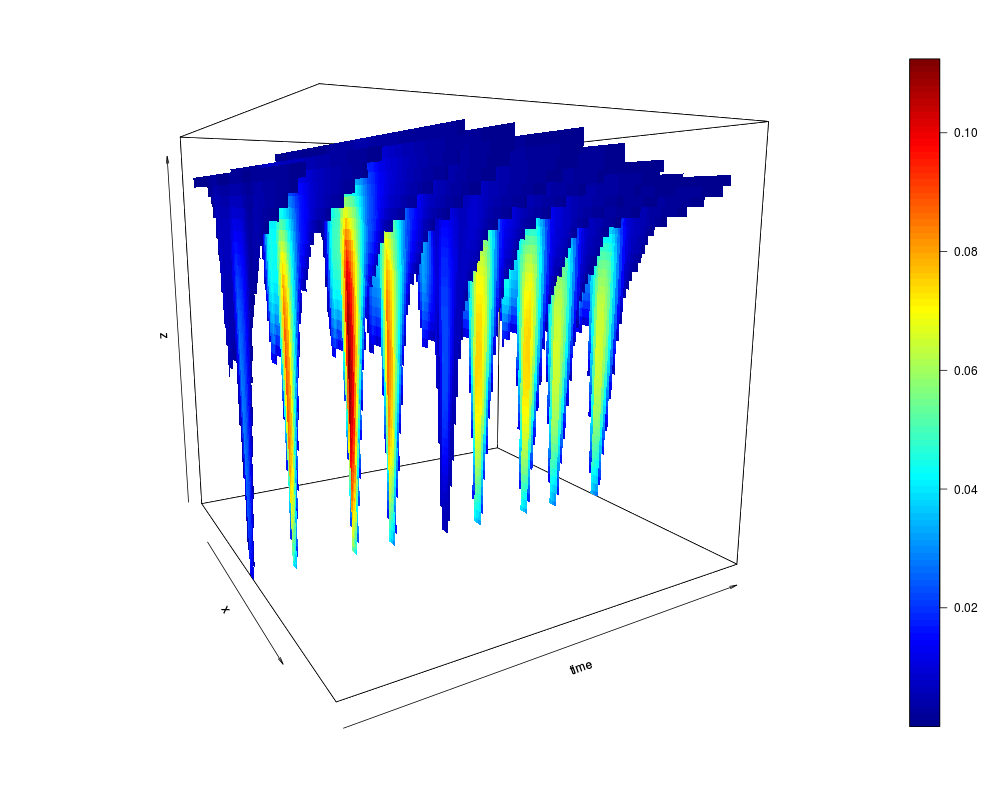
par(mfrow = c(1, 1))
# make depth the last dimension
cv <- aperm(visc$var, c(1, 3, 2))
# visualise as slices
slice3D(colvar = cv, x = visc$x, y = visc$y, z = -visc$depth,
phi = 10, theta = 60, ylab = "time",
xs = NULL, zs = NULL, ys = visc$y, NAcol = "transparent")
# restore plotting parameters
par(mfrow = pm)
Results
R version 3.3.1 (2016-06-21) -- "Bug in Your Hair"
Copyright (C) 2016 The R Foundation for Statistical Computing
Platform: x86_64-pc-linux-gnu (64-bit)

R is free software and comes with ABSOLUTELY NO WARRANTY.
You are welcome to redistribute it under certain conditions.
Type 'license()' or 'licence()' for distribution details.

R is a collaborative project with many contributors.
Type 'contributors()' for more information and
'citation()' on how to cite R or R packages in publications.

Type 'demo()' for some demos, 'help()' for on-line help, or
'help.start()' for an HTML browser interface to help.
Type 'q()' to quit R.

> library(OceanView)
Loading required package: plot3D
Loading required package: plot3Drgl
Loading required package: rgl
> png(filename="/home/ddbj/snapshot/RGM3/R_CC/result/OceanView/mapping.Rd_%03d_medium.png", width=480, height=480)
> ### Name: Map and extract data
> ### Title: Functions for remapping, changing the resolution, and extracting
> ###   from 2-D or 3-D data.
> ### Aliases: remap remap.matrix remap.array changeres changeres.matrix
> ###   changeres.array extract extract.matrix extract.array transect
> ###   mapsigma mapsigma.matrix mapsigma.array transectsigma
> ### Keywords: hplot
>
> ### ** Examples
>
> # save plotting parameters
>  pm <- par("mfrow")
>
> ## =======================================================================
> ## Simple examples
> ## =======================================================================
>  M <- matrix(nrow = 2, data = 1:4)
>  remap(M, x = 1:2, y = 1:2,
+    xto = seq(1, 2, length.out = 3), yto = 1:2)
$var
     [,1] [,2]
[1,]  1.0  3.0
[2,]  1.5  3.5
[3,]  2.0  4.0

$x
[1] 1.0 1.5 2.0

$y
[1] 1 2

>
>  changeres(M, x = 1:2, y = 1:2, resfac = c(2, 1))
$var
     [,1] [,2]
[1,]  1.0  3.0
[2,]  1.5  3.5
[3,]  2.0  4.0

$x
[1] 1.0 1.5 2.0

$y
[1] 1 2

>  changeres(M, x = 1:2, y = 1:2, resfac = 2)
$var
     [,1] [,2] [,3]
[1,]  1.0  2.0  3.0
[2,]  1.5  2.5  3.5
[3,]  2.0  3.0  4.0

$x
[1] 1.0 1.5 2.0

$y
[1] 1.0 1.5 2.0

>
> # x and or y are a matrix.
>  changeres(var = M, x = M, y = 1:2, resfac = c(2, 1))
$var
     [,1] [,2]
[1,]  1.0  3.0
[2,]  1.5  3.5
[3,]  2.0  4.0

$x
     [,1] [,2]
[1,]  1.0  3.0
[2,]  1.5  3.5
[3,]  2.0  4.0

$y
     [,1] [,2]
[1,]  1.0  1.0
[2,]  1.5  1.5
[3,]  2.0  2.0

>  changeres(M, x = M, y = 1:2, resfac = 2)
$var
     [,1] [,2] [,3]
[1,]  1.0  2.0  3.0
[2,]  1.5  2.5  3.5
[3,]  2.0  3.0  4.0

$x
     [,1] [,2] [,3]
[1,]  1.0  2.0  3.0
[2,]  1.5  2.5  3.5
[3,]  2.0  3.0  4.0

$y
     [,1] [,2] [,3]
[1,]  1.0  1.0  1.0
[2,]  1.5  1.5  1.5
[3,]  2.0  2.0  2.0

>
>
> ## =======================================================================
> ## Use remap to add more detail to a slice3D plot
> ## =======================================================================
>
>  par(mfrow = c(1, 1))
>  x <- y <- z <- seq(-4, 4, by = 0.5)
>  M <- mesh(x, y, z)
>
>  R <- with (M, sqrt(x^2 + y^2 + z^2))
>  p <- sin(2*R) /(R+1e-3)
>
>  slice3D(x, y, z, ys = seq(-4, 4, by = 2), theta = 85,
+    colvar = p, pch = ".", clim = range(p))
>
>  xto <- yto <- zto <- seq(-1.2, 1.2, 0.3)
>  Res <- remap (p, x, y, z, xto, yto, zto)
>
> # expand grid for scatterplot
>  Mt  <- mesh(Res$x, Res$y, Res$z)
>
>  scatter3D(x = Mt$x, y = Mt$y, z = Mt$z, colvar = Res$var,
+    pch = ".", add = TRUE, cex = 3, clim = range(p))
>
> # same in rgl:
>  ## Not run:
> ##D    plotrgl()
> ##D
> ## End(Not run)
>
> # extract specific values from 3-D data
>  xyzto <- matrix(nrow = 2, data = c(1, 1, 1, 2, 2, 2), byrow = TRUE)
>  extract(var = p, x, y, z, xyzto = xyzto)
$var
[1] -0.1828839  0.1735051

$xyz
     x y z
[1,] 1 1 1
[2,] 2 2 2

>
> # a transect
>  to <- cbind(seq(-4, 4, length.out = 20), seq(-4, 4, length.out = 20))
>  image2D( transect(p, x, y, z, to = to)$var)
>
> ## =======================================================================
> ## change the resolution of a 2-D image
> ## =======================================================================
>
>  par(mfrow = c(2, 2))
>  nr <- nrow(volcano)
>  nc <- ncol(volcano)
>
>  x  <- 1 : nr
>  y  <- 1 : nc
>  image2D(x = x, y = y, volcano, main = "original")
>
> # increasing the resolution
>  x2 <- seq(from = 1, to = nr, by = 0.5)
>  y2 <- seq(from = 1, to = nc, by = 0.5)
>
>  VOLC1 <- remap(volcano, x = x, y = y, xto = x2, yto = y2)$var
>  image2D(x = x2, y = y2, z = VOLC1, main = "high resolution")
>
> # low resolution
>  xb <- seq(from = 1, to = nr, by = 2)
>  yb <- seq(from = 1, to = nc, by = 3)
>  VOLC2 <- remap(volcano, x, y, xb, yb)$var
>  image2D(VOLC2, main = "low resolution")
>
> # zooming in high resolution
>  xc <- seq(10, 40, 0.1)
>  yc <- seq(10, 40, 0.1)
>
>  VOLC3 <- remap(volcano,x, y, xc, yc)$var
>  image2D(VOLC3, main = "zoom")
>
> # Get one value or a grid of values
>  remap(volcano, x, y, xto = 2.5,     yto = 5)
$var
      [,1]
[1,] 102.5

$x
[1] 2.5

$y
[1] 5

>  remap(volcano, x, y, xto = c(2, 5), yto = c(5, 10))
$var
     [,1] [,2]
[1,]  102  101
[2,]  105  103

$x
[1] 2 5

$y
[1]  5 10

>
> # Specific values
>  extract(volcano, x, y, xyto = cbind(c(2, 5), c(5, 10)))
$var
[1] 102 103

$xy
     x  y
[1,] 2  5
[2,] 5 10

>
> ## =======================================================================
> ## take a cross section or transect of volcano
> ## =======================================================================
>
>  par(mfrow = c(2, 1))
>  image2D(volcano, x = 1:nr, y = 1:nc)
>  xyto <- cbind(seq(from = 1,  to = nr, length.out = 20),
+                seq(from = 20, to = nc, length.out = 20))
>  points(xyto[,1], xyto[,2], pch = 16)
>
>  (Crossection <- extract (volcano, x = 1:nr, y = 1:nc,
+                              xyto = xyto))
$var
 [1] 102.00000 112.86427 140.64820 170.94737 191.73684 173.60665 153.63989
 [8] 156.84211 165.26316 149.41551 133.15235 130.52632 120.45983 110.00000
[15] 105.21053 100.00000  96.00000  96.00000  94.52632  94.00000

$xy
              x        y
 [1,]  1.000000 20.00000
 [2,]  5.526316 22.15789
 [3,] 10.052632 24.31579
 [4,] 14.578947 26.47368
 [5,] 19.105263 28.63158
 [6,] 23.631579 30.78947
 [7,] 28.157895 32.94737
 [8,] 32.684211 35.10526
 [9,] 37.210526 37.26316
[10,] 41.736842 39.42105
[11,] 46.263158 41.57895
[12,] 50.789474 43.73684
[13,] 55.315789 45.89474
[14,] 59.842105 48.05263
[15,] 64.368421 50.21053
[16,] 68.894737 52.36842
[17,] 73.421053 54.52632
[18,] 77.947368 56.68421
[19,] 82.473684 58.84211
[20,] 87.000000 61.00000

>
>  scatter2D(xyto[, 1], Crossection$var, colvar = Crossection$var,
+    type = "b", cex = 2, pch = 16)
>
> ## =======================================================================
> ##  mapsigma: changing from sigma coordinates into depth-coordinates
> ## =======================================================================
>
>  par(mfrow = c(2, 2))
>  var <- t(matrix (nrow = 10, ncol = 10, data = 1:10))
>  image2D(var, ylab = "sigma", main = "values in sigma coordinates",
+        clab = "var")
>
>  # The depth at each 'column'
>  Depth <- approx(x = 1:5, y = c(10, 4, 5, 6, 4),
+                  xout = seq(1,5, length.out = 10))$y
>
> # Sigma coordinates
>  sigma <- t(matrix(nrow = 10, ncol = 10, data = Depth, byrow = TRUE) *
+                 seq(from = 0, to = 1, length = 10))
>  matplot(sigma, type = "l", main = "sigma coordinates",
+          xlab = "sigma", ylab = "depth", ylim = c(10, 0))
>
> # Mapping to the default depth coordinates
>  varz <- mapsigma(var = var, sigma = sigma)
>  image2D(varz$var, y = varz$depth, NAcol = "black", ylim = c(10, 0),
+        clab = "var", ylab = "depth",
+        main = "depth-coord, low resolution")
>
> # Mapping at higher resolution of depth coordinates
>  varz <- mapsigma(var, sigma = sigma, resfac = 10)
>  image2D(varz$var, y = varz$depth, NAcol = "black", ylim = c(10, 0),
+        clab = "var", ylab = "depth",
+        main = "depth-coord, high resolution")
>
> ## =======================================================================
> ##  mapsigma: mapping to depth for data Sylttran (x, sigma, time)
> ## =======================================================================
>
> # depth values
>  D <- seq(-1, 20, by = 0.5)
>  dim(Sylttran$visc)
[1] 50 21 21
>
> # sigma coordinates are the second dimension (signr)
> # resolution is increased for 'x' and decreased for 'time'
>
>  visc <- mapsigma(Sylttran$visc, x = Sylttran$x, y = Sylttran$time,
+   sigma = Sylttran$sigma, signr = 2, depth = D, resfac = c(2, 1, 0.4))
>
> # changed dimensions
>  dim(visc$var)
[1] 99 43  9
>
>  image2D(visc$var, x = visc$x, y = -visc$depth, ylim = c(-20, 1),
+   main = paste("eddy visc,", format(visc$y, digits = 2), " hr"),
+   ylab = "m", xlab = "x", clab = c("","m2/s"),
+   clim = range(visc$var, na.rm = TRUE))
>
>  par(mfrow = c(1, 1))
> # make depth the last dimension
>  cv <- aperm(visc$var, c(1, 3, 2))
>
> # visualise as slices
>  slice3D(colvar = cv, x = visc$x, y = visc$y, z = -visc$depth,
+    phi = 10, theta = 60, ylab = "time",
+    xs = NULL, zs = NULL, ys = visc$y, NAcol = "transparent")
>
> # restore plotting parameters
>  par(mfrow = pm)
>
>
>
>
>
> dev.off()
null device
          1
>
|