## S3 method for class 'oncoscore'
plot(x, gene.number = 5, main = "OncoScore",
  xlab = "score", ylab = "genes", file = NA, ...)
Arguments
x
input data as result of the function compute.OncoScore
gene.number
number of genes to print
main
the title
xlab
description of x asix (defaul score)
ylab
description of y asix (defaul genes)
file
where to save the plot
...
additional parameter to pass to the barplot function
Value
A plot
Examples
data(query)
result = compute.oncoscore(query)
plot.oncoscore(result)
Results
R version 3.3.1 (2016-06-21) -- "Bug in Your Hair"
Copyright (C) 2016 The R Foundation for Statistical Computing
Platform: x86_64-pc-linux-gnu (64-bit)
R is free software and comes with ABSOLUTELY NO WARRANTY.
You are welcome to redistribute it under certain conditions.
Type 'license()' or 'licence()' for distribution details.
R is a collaborative project with many contributors.
Type 'contributors()' for more information and
'citation()' on how to cite R or R packages in publications.
Type 'demo()' for some demos, 'help()' for on-line help, or
'help.start()' for an HTML browser interface to help.
Type 'q()' to quit R.
> library(OncoScore)
> png(filename="/home/ddbj/snapshot/RGM3/R_BC/result/OncoScore/plot.oncoscore.Rd_%03d_medium.png", width=480, height=480)
> ### Name: plot.oncoscore
> ### Title: plot.oncoscore
> ### Aliases: plot.oncoscore
>
> ### ** Examples
>
> data(query)
> result = compute.oncoscore(query)
### Processing data
### Computing frequencies scores
### Estimating oncogenes
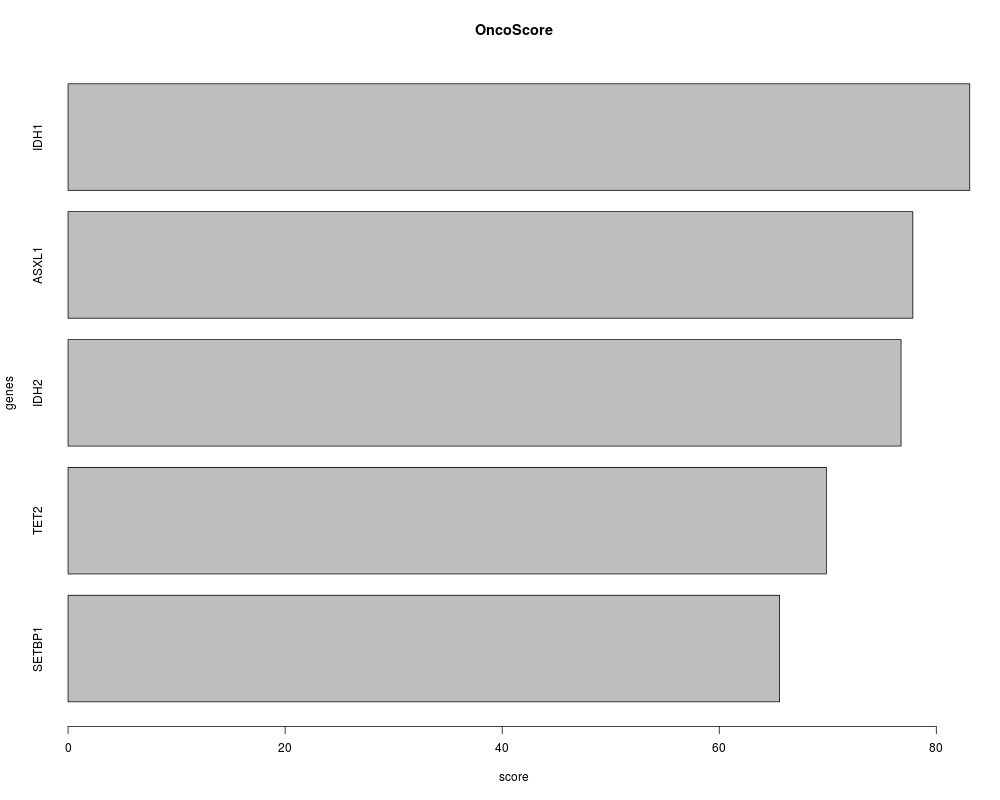
### Results:
ASXL1 -> 77.8392
IDH1 -> 83.08351
IDH2 -> 76.75356
SETBP1 -> 65.556
TET2 -> 69.86954
> plot.oncoscore(result)
>
>
>
>
>
>
> dev.off()
null device
1
>
 .
.