Supported by Dr. Osamu Ogasawara and  . . |
|
Last data update: 2014.03.03 |
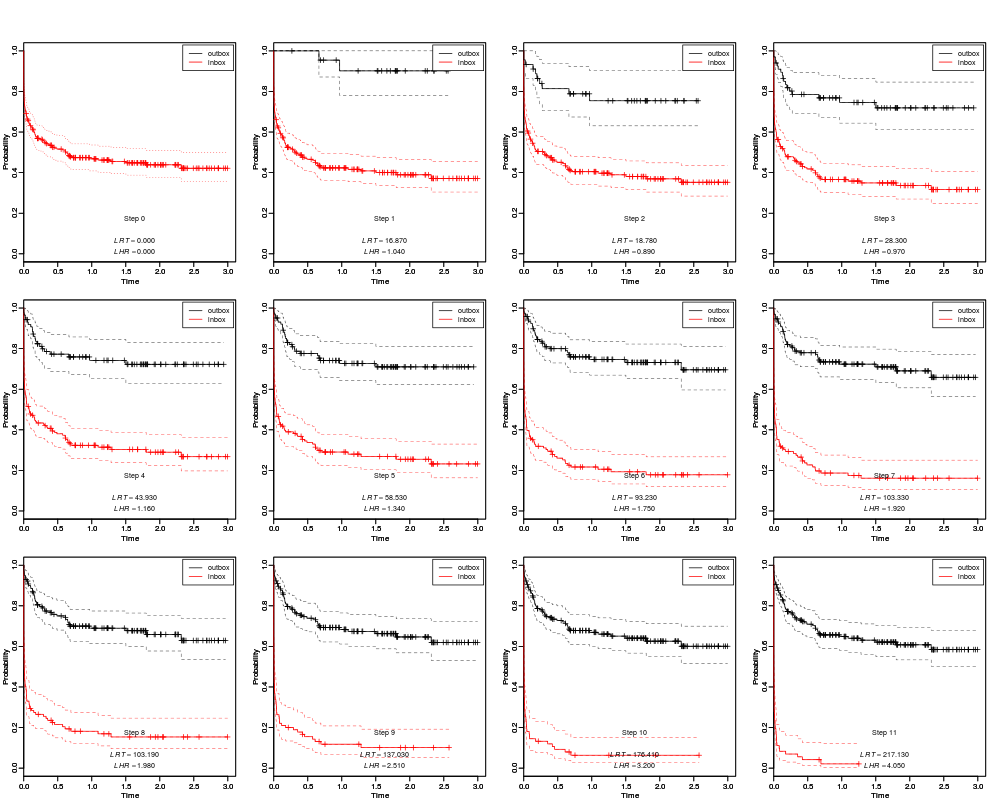
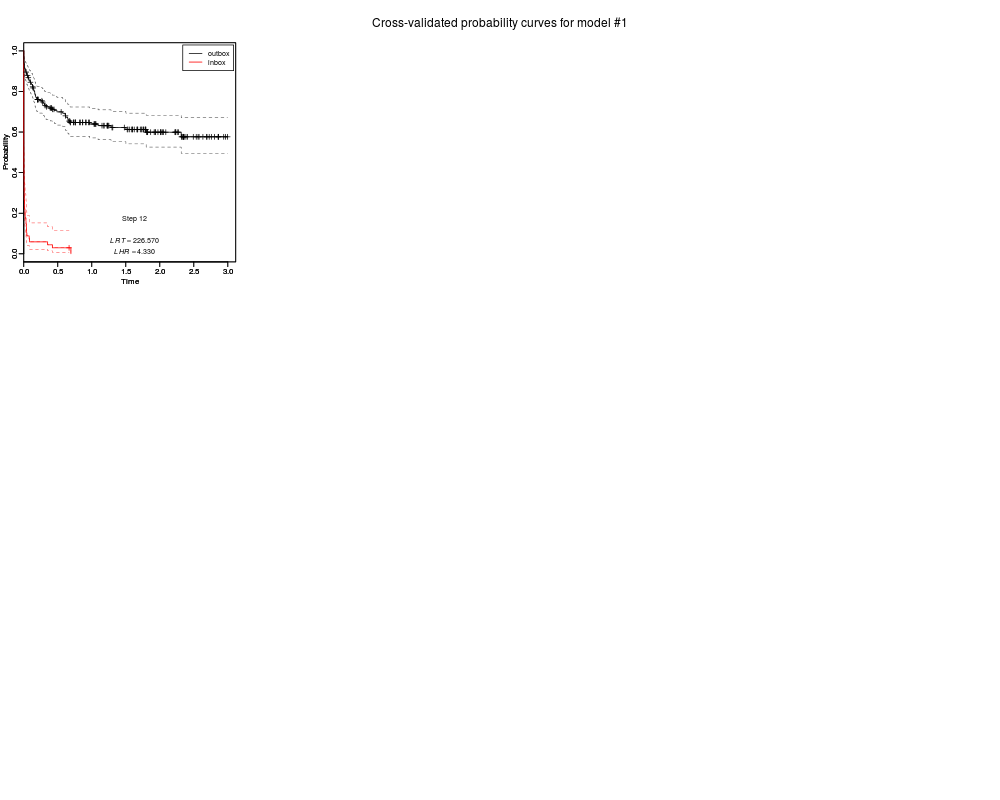
Visualization of Survival DistributionsDescriptionFunction for plotting the cross-validated survival distributions of a Usage
  plot_boxkm(object,
             main = NULL,
             xlab = "Time",
             ylab = "Probability",
             precision = 1e-3,
             mark = 3,
             col = 2,
             cex = 1,
             steps = 1:object$cvfit$cv.nsteps,
             nr = 3,
             nc = 4,
             device = NULL,
             file = "Survival Plots",
             path=getwd(),
             horizontal = TRUE,
             width = 11,
             height = 8.5, ...)
Arguments
DetailsSome of the plotting parameters are further defined in the function ValueInvisible. None. Displays the plot(s) on the specified NoteEnd-user plotting function. Author(s)
Maintainer: "Jean-Eudes Dazard, Ph.D." jxd101@case.edu Acknowledgments: This project was partially funded by the National Institutes of Health NIH - National Cancer Institute (R01-CA160593) to J-E. Dazard and J.S. Rao. References
See Also
Examples
#===================================================
# Loading the library and its dependencies
#===================================================
library("PRIMsrc")

#=================================================================================
# Simulated dataset #1 (n=250, p=3)
# Non Replicated Combined Cross-Validation (RCCV)
# Peeling criterion = LRT
# Optimization criterion = LRT
#=================================================================================
CVCOMB.synt1 <- sbh(dataset = Synthetic.1,
                    cvtype = "combined", cvcriterion = "lrt",
                    B = 1, K = 5,
                    vs = TRUE, cpv = FALSE,
                    decimals = 2, probval = 0.5,
                    arg = "beta=0.05,
                           alpha=0.1,
                           minn=10,
                           L=NULL,
                           peelcriterion="lr"",
                    parallel = FALSE, conf = NULL, seed = 123)

plot_boxkm(object = CVCOMB.synt1,
           main = paste("Cross-validated probability curves for model #1", sep=""),
           xlab = "Time", ylab = "Probability",
           device = NULL, file = "Survival Plots", path=getwd(),
           horizontal = TRUE, width = 11, height = 8.5)
Results
R version 3.3.1 (2016-06-21) -- "Bug in Your Hair"
Copyright (C) 2016 The R Foundation for Statistical Computing
Platform: x86_64-pc-linux-gnu (64-bit)

R is free software and comes with ABSOLUTELY NO WARRANTY.
You are welcome to redistribute it under certain conditions.
Type 'license()' or 'licence()' for distribution details.

R is a collaborative project with many contributors.
Type 'contributors()' for more information and
'citation()' on how to cite R or R packages in publications.

Type 'demo()' for some demos, 'help()' for on-line help, or
'help.start()' for an HTML browser interface to help.
Type 'q()' to quit R.

> library(PRIMsrc)
Loading required package: parallel
Loading required package: survival
Loading required package: Hmisc
Loading required package: lattice
Loading required package: Formula
Loading required package: ggplot2

Attaching package: 'Hmisc'

The following objects are masked from 'package:base':

    format.pval, round.POSIXt, trunc.POSIXt, units

Loading required package: glmnet
Loading required package: Matrix
Loading required package: foreach
Loaded glmnet 2.0-5

Loading required package: MASS
PRIMsrc 0.6.3
Type PRIMsrc.news() to see new features, changes, and bug fixes

> png(filename="/home/ddbj/snapshot/RGM3/R_CC/result/PRIMsrc/plot_boxkm.Rd_%03d_medium.png", width=480, height=480)
> ### Name: plot_boxkm
> ### Title: Visualization of Survival Distributions
> ### Aliases: plot_boxkm
> ### Keywords: Exploratory Survival/Risk Analysis Survival/Risk Estimation &
> ###   Prediction Non-Parametric Method Cross-Validation Bump Hunting
> ###   Rule-Induction Method
>
> ### ** Examples
>
> #===================================================
> # Loading the library and its dependencies
> #===================================================
> library("PRIMsrc")
>
> #=================================================================================
> # Simulated dataset #1 (n=250, p=3)
> # Non Replicated Combined Cross-Validation (RCCV)
> # Peeling criterion = LRT
> # Optimization criterion = LRT
> #=================================================================================
> CVCOMB.synt1 <- sbh(dataset = Synthetic.1,
+                     cvtype = "combined", cvcriterion = "lrt",
+                     B = 1, K = 5,
+                     vs = TRUE, cpv = FALSE,
+                     decimals = 2, probval = 0.5,
+                     arg = "beta=0.05,
+                            alpha=0.1,
+                            minn=10,
+                            L=NULL,
+                            peelcriterion="lr"",
+                     parallel = FALSE, conf = NULL, seed = 123)

Survival dataset provided.

Requested single 5-fold cross-validation without replications
Cross-validation technique:  COMBINED
Cross-validation criterion:  LRT
Variable pre-selection: TRUE
Computation of permutation p-values: FALSE
Peeling criterion:  LRT
Parallelization: FALSE

Pre-selection of covariates and determination of directions of peeling...
Pre-selected covariates:
X1 X2 X3
 1  2  3
Directions of peeling at each step of pre-selected covariates:
X1 X2 X3
 1 -1 -1
Fitting and cross-validating the Survival Bump Hunting model using the PRSP algorithm ...
replicate : 1
seed : 123
Fold : 1
Fold : 2
Fold : 3
Fold : 4
Fold : 5
Success! 1 (replicated) cross-validation(s) has(ve) completed
Generating cross-validated optimal peeling lengths from all replicates ...
Generating cross-validated box memberships at each step ...
Generating cross-validated box rules for the pre-selected covariates at each step ...
Generating cross-validated modal trace values of covariate usage at each step ...
Covariates used for peeling at each step, based on covariate trace modal values:
X1 X2
 1  2
Generating cross-validated box statistics at each step ...
Finished!
>
> plot_boxkm(object = CVCOMB.synt1,
+            main = paste("Cross-validated probability curves for model #1", sep=""),
+            xlab = "Time", ylab = "Probability",
+            device = NULL, file = "Survival Plots", path=getwd(),
+            horizontal = TRUE, width = 11, height = 8.5)
Device:  2
>
>
>
>
>
> dev.off()
null device
          1
>
|