Supported by Dr. Osamu Ogasawara and  . . |
|
Last data update: 2014.03.03 |
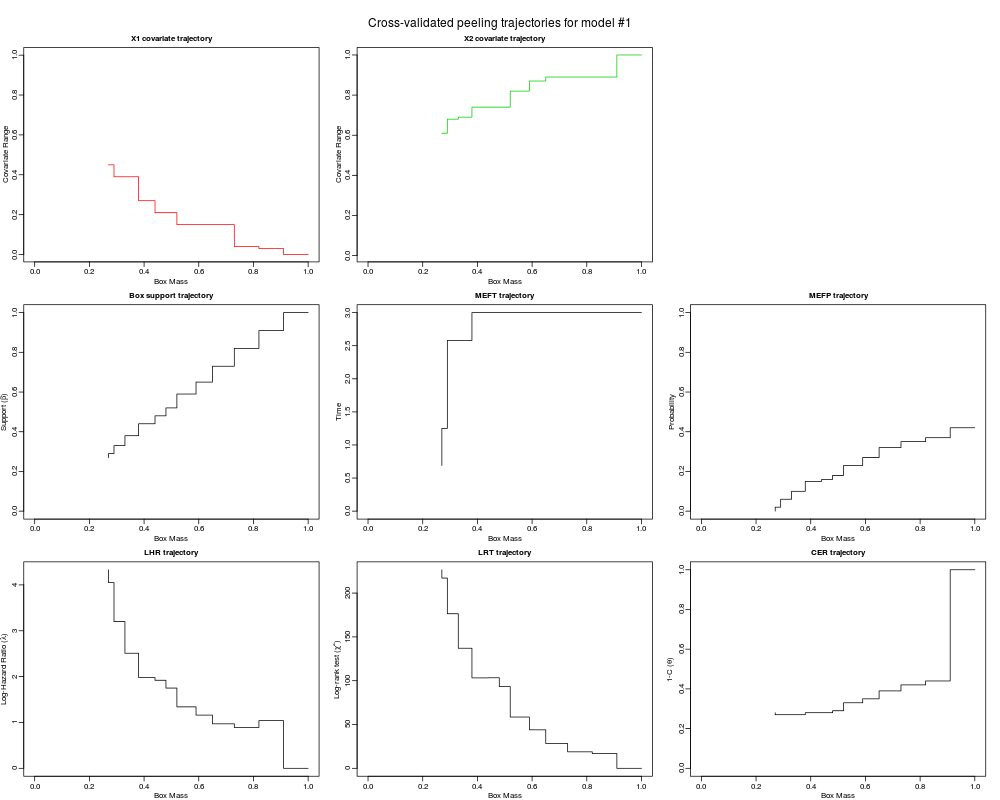
Visualization of Peeling Trajectories/ProfilesDescriptionFunction for plotting the cross-validated peeling trajectories/profiles of a Usage
  plot_boxtraj(object,
               main = NULL,
               toplot = object$cvfit$cv.used,
               col.cov,
               lty.cov,
               lwd.cov,
               col = 1,
               lty = 1,
               lwd = 1,
               cex = 1,
               add.legend = FALSE,
               text.legend = NULL,
               nr = NULL,
               nc = NULL,
               device = NULL,
               file = "Trajectory Plots",
               path=getwd(),
               horizontal = FALSE,
               width = 8.5,
               height = 11, ...)
Arguments
DetailsThe plot limits the display of trajectories to those only covariates that are used for peeling. The plot includes box descriptive statistics (such as support), survival endpoint statistics (such as Maximum Event-Free Time (MEFT), Minimum Event-Free Probability (MEVP), LHR, LRT) and prediction performance (such as CER). ValueInvisible. None. Displays the plot(s) on the specified NoteEnd-user plotting function. Author(s)
Maintainer: "Jean-Eudes Dazard, Ph.D." jxd101@case.edu Acknowledgments: This project was partially funded by the National Institutes of Health NIH - National Cancer Institute (R01-CA160593) to J-E. Dazard and J.S. Rao. References
Examples
#===================================================
# Loading the library and its dependencies
#===================================================
library("PRIMsrc")

#=================================================================================
# Simulated dataset #1 (n=250, p=3)
# Non Replicated Combined Cross-Validation (RCCV)
# Peeling criterion = LRT
# Optimization criterion = LRT
#=================================================================================
CVCOMB.synt1 <- sbh(dataset = Synthetic.1,
                    cvtype = "combined", cvcriterion = "lrt",
                    B = 1, K = 5,
                    vs = TRUE, cpv = FALSE,
                    decimals = 2, probval = 0.5,
                    arg = "beta=0.05,
                           alpha=0.1,
                           minn=10,
                           L=NULL,
                           peelcriterion="lr"",
                    parallel = FALSE, conf = NULL, seed = 123)

plot_boxtraj(object = CVCOMB.synt1,
             main = paste("Cross-validated peeling trajectories for model #1", sep=""),
             toplot = CVCOMB.synt1$cvfit$cv.used,
             device = NULL, file = "Trajectory Plots", path=getwd(),
             horizontal = FALSE, width = 8.5, height = 11)
Results
R version 3.3.1 (2016-06-21) -- "Bug in Your Hair"
Copyright (C) 2016 The R Foundation for Statistical Computing
Platform: x86_64-pc-linux-gnu (64-bit)

R is free software and comes with ABSOLUTELY NO WARRANTY.
You are welcome to redistribute it under certain conditions.
Type 'license()' or 'licence()' for distribution details.

R is a collaborative project with many contributors.
Type 'contributors()' for more information and
'citation()' on how to cite R or R packages in publications.

Type 'demo()' for some demos, 'help()' for on-line help, or
'help.start()' for an HTML browser interface to help.
Type 'q()' to quit R.

> library(PRIMsrc)
Loading required package: parallel
Loading required package: survival
Loading required package: Hmisc
Loading required package: lattice
Loading required package: Formula
Loading required package: ggplot2

Attaching package: 'Hmisc'

The following objects are masked from 'package:base':

    format.pval, round.POSIXt, trunc.POSIXt, units

Loading required package: glmnet
Loading required package: Matrix
Loading required package: foreach
Loaded glmnet 2.0-5

Loading required package: MASS
PRIMsrc 0.6.3
Type PRIMsrc.news() to see new features, changes, and bug fixes

> png(filename="/home/ddbj/snapshot/RGM3/R_CC/result/PRIMsrc/plot_boxtraj.Rd_%03d_medium.png", width=480, height=480)
> ### Name: plot_boxtraj
> ### Title: Visualization of Peeling Trajectories/Profiles
> ### Aliases: plot_boxtraj
> ### Keywords: Exploratory Survival/Risk Analysis Survival/Risk Estimation &
> ###   Prediction Non-Parametric Method Cross-Validation Bump Hunting
> ###   Rule-Induction Method
>
> ### ** Examples
>
> #===================================================
> # Loading the library and its dependencies
> #===================================================
> library("PRIMsrc")
>
> #=================================================================================
> # Simulated dataset #1 (n=250, p=3)
> # Non Replicated Combined Cross-Validation (RCCV)
> # Peeling criterion = LRT
> # Optimization criterion = LRT
> #=================================================================================
> CVCOMB.synt1 <- sbh(dataset = Synthetic.1,
+                     cvtype = "combined", cvcriterion = "lrt",
+                     B = 1, K = 5,
+                     vs = TRUE, cpv = FALSE,
+                     decimals = 2, probval = 0.5,
+                     arg = "beta=0.05,
+                            alpha=0.1,
+                            minn=10,
+                            L=NULL,
+                            peelcriterion="lr"",
+                     parallel = FALSE, conf = NULL, seed = 123)

Survival dataset provided.

Requested single 5-fold cross-validation without replications
Cross-validation technique:  COMBINED
Cross-validation criterion:  LRT
Variable pre-selection: TRUE
Computation of permutation p-values: FALSE
Peeling criterion:  LRT
Parallelization: FALSE

Pre-selection of covariates and determination of directions of peeling...
Pre-selected covariates:
X1 X2 X3
 1  2  3
Directions of peeling at each step of pre-selected covariates:
X1 X2 X3
 1 -1 -1
Fitting and cross-validating the Survival Bump Hunting model using the PRSP algorithm ...
replicate : 1
seed : 123
Fold : 1
Fold : 2
Fold : 3
Fold : 4
Fold : 5
Success! 1 (replicated) cross-validation(s) has(ve) completed
Generating cross-validated optimal peeling lengths from all replicates ...
Generating cross-validated box memberships at each step ...
Generating cross-validated box rules for the pre-selected covariates at each step ...
Generating cross-validated modal trace values of covariate usage at each step ...
Covariates used for peeling at each step, based on covariate trace modal values:
X1 X2
 1  2
Generating cross-validated box statistics at each step ...
Finished!
>
> plot_boxtraj(object = CVCOMB.synt1,
+              main = paste("Cross-validated peeling trajectories for model #1", sep=""),
+              toplot = CVCOMB.synt1$cvfit$cv.used,
+              device = NULL, file = "Trajectory Plots", path=getwd(),
+              horizontal = FALSE, width = 8.5, height = 11)
Device:  2
>
>
>
>
>
> dev.off()
null device
          1
>
|