Supported by Dr. Osamu Ogasawara and  . . |
|
Last data update: 2014.03.03 |
Compare balance graphically of a categorical covariate as part of a PSADescriptionGiven predefined strata and two level treatment for a categorical covariate from a propensity score analysis,
Usage
cat.psa(categorical, treatment = NULL, strata = NULL,
catnames = NULL, catcol = "terrain.colors", width = 0.25,
barlab = c("A","B"), barnames = NULL,
rtmar = 1.5, balance = FALSE, B = 1000, tbl = TRUE,
cex.leg = 1, ...)
Arguments
DetailsPairs of bars are graphed side by side so that comparisons may be made within each stratum and across strata.
If ValueIf Author(s)James E. Helmreich James.Helmreich@Marist.edu Robert M. Pruzek RMPruzek@yahoo.com See Also
Examples
categorical<-sample(1:7,1000,replace=TRUE)
treatment<-sample(c(0,1),1000,replace=TRUE)
strata<-sample(5,1000,replace=TRUE)
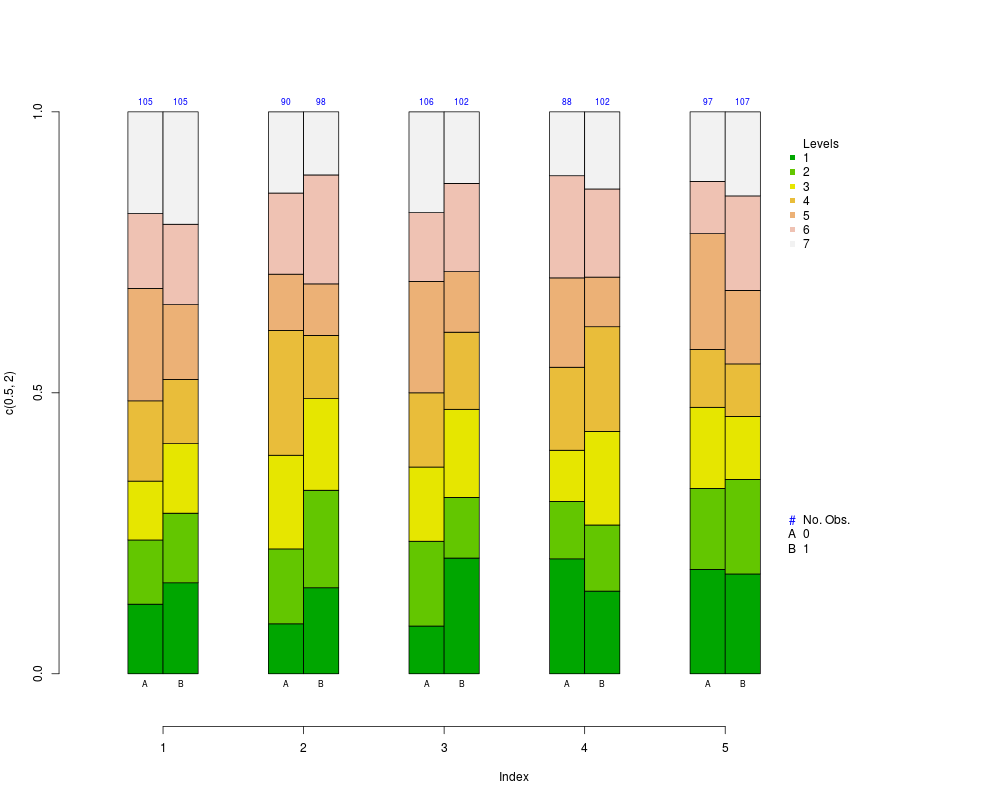
cat.psa(categorical,treatment,strata)
data(lindner)
attach(lindner)
lindner.ps <- glm(abcix ~ stent + height + female +
diabetic + acutemi + ejecfrac + ves1proc,
data = lindner, family = binomial)
ps<-lindner.ps$fitted
lindner.s5 <- as.numeric(cut(ps, quantile(ps, seq(0, 1, 1/5)),
include.lowest = TRUE, labels = FALSE))
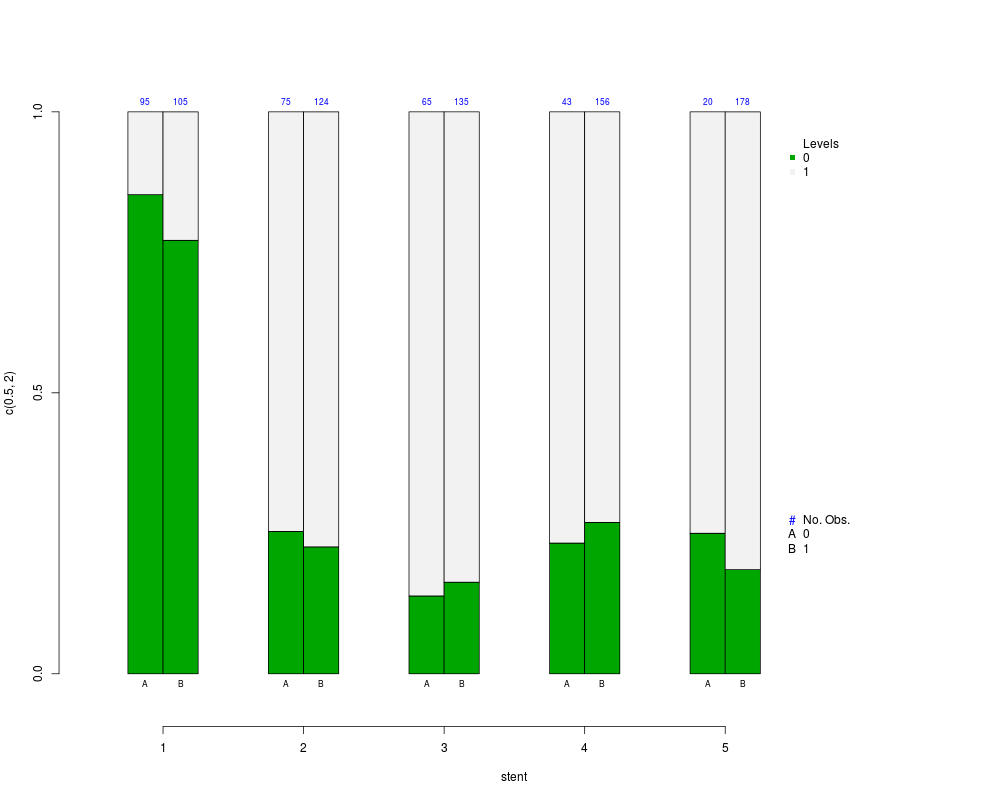
cat.psa(stent, abcix, lindner.s5, xlab = "stent")
lindner.s10 <- as.numeric(cut(ps, quantile(ps, seq(0, 1, 1/10)),
include.lowest = TRUE, labels = FALSE))
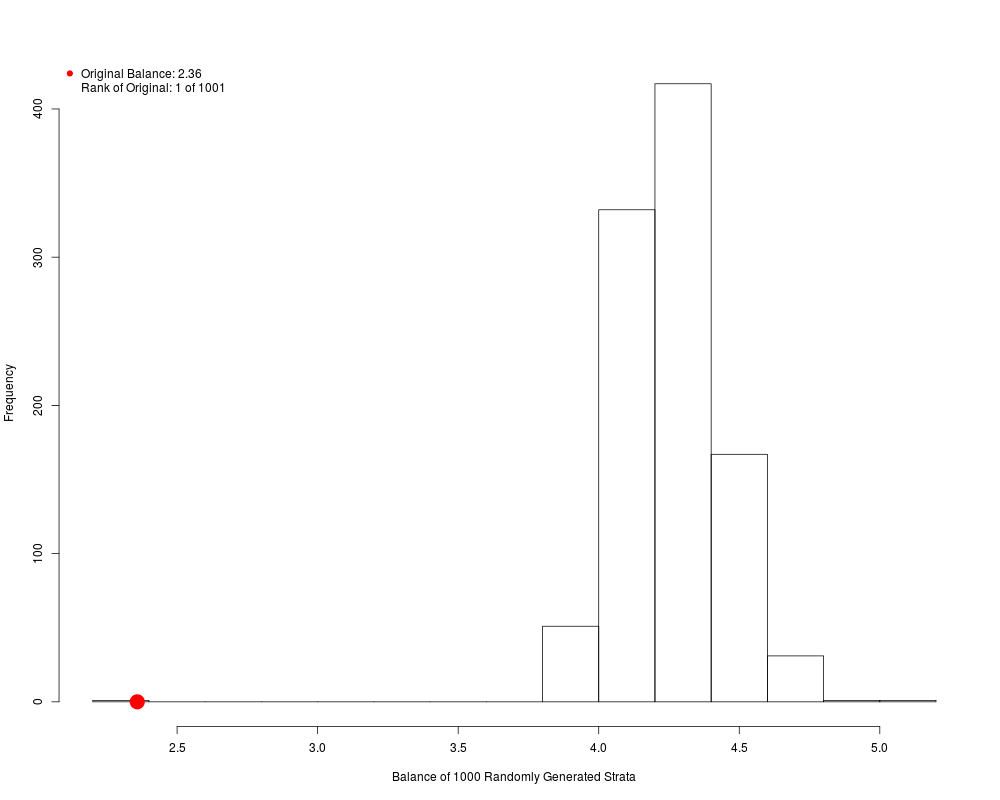
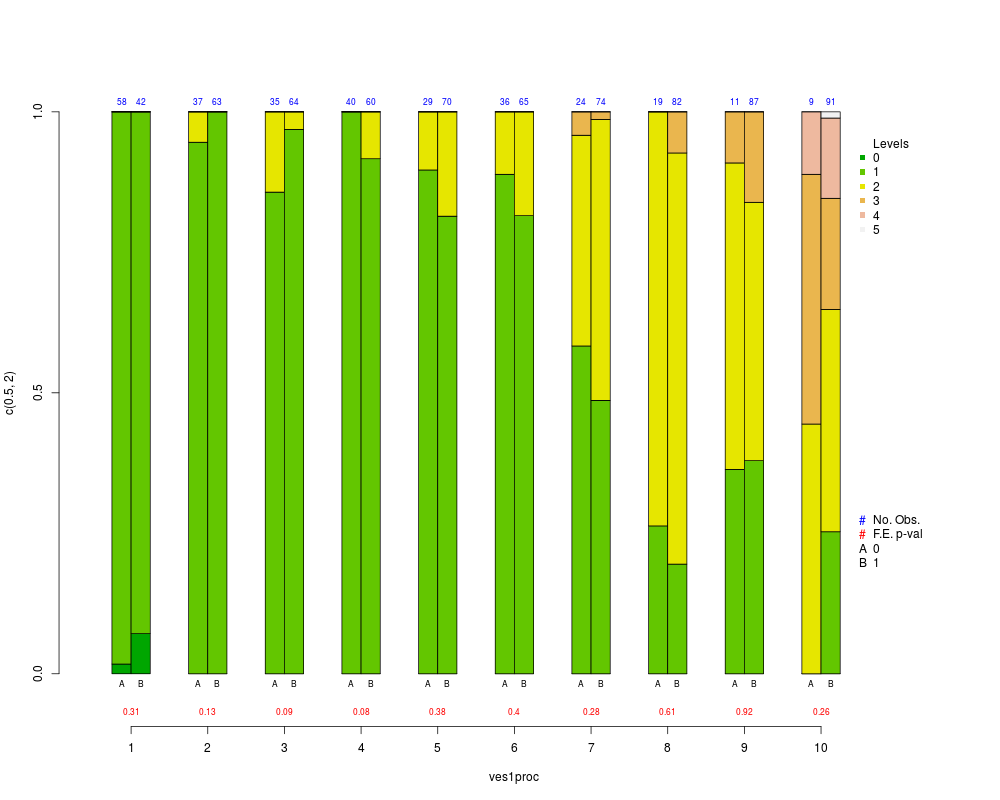
cat.psa(ves1proc,abcix, lindner.s10, balance = TRUE, xlab = "ves1proc")
#Using a rpart tree for strata
library(rpart)
lindner.rpart<-rpart(abcix ~ stent + height + female + diabetic +
acutemi + ejecfrac + ves1proc, data=lindner, method="class")
lindner.tree<-factor(lindner.rpart$where, labels = 1:6)
cat.psa(stent, abcix, lindner.tree, xlab = "stent")
cat.psa(ves1proc, abcix, lindner.tree, xlab = "ves1proc")
Results
R version 3.3.1 (2016-06-21) -- "Bug in Your Hair"
Copyright (C) 2016 The R Foundation for Statistical Computing
Platform: x86_64-pc-linux-gnu (64-bit)
R is free software and comes with ABSOLUTELY NO WARRANTY.
You are welcome to redistribute it under certain conditions.
Type 'license()' or 'licence()' for distribution details.
R is a collaborative project with many contributors.
Type 'contributors()' for more information and
'citation()' on how to cite R or R packages in publications.
Type 'demo()' for some demos, 'help()' for on-line help, or
'help.start()' for an HTML browser interface to help.
Type 'q()' to quit R.
> library(PSAgraphics)
Loading required package: rpart
> png(filename="/home/ddbj/snapshot/RGM3/R_CC/result/PSAgraphics/cat.psa.Rd_%03d_medium.png", width=480, height=480)
> ### Name: cat.psa
> ### Title: Compare balance graphically of a categorical covariate as part
> ### of a PSA
> ### Aliases: cat.psa
> ### Keywords: hplot htest
>
> ### ** Examples
>
> categorical<-sample(1:7,1000,replace=TRUE)
> treatment<-sample(c(0,1),1000,replace=TRUE)
> strata<-sample(5,1000,replace=TRUE)
> cat.psa(categorical,treatment,strata)
$`treatment:stratum.proportions`
0:1 1:1 0:2 1:2 0:3 1:3 0:4 1:4 0:5 1:5
1 0.124 0.202 0.147 0.130 0.22 0.174 0.141 0.142 0.175 0.152
2 0.206 0.179 0.088 0.176 0.18 0.157 0.120 0.160 0.093 0.152
3 0.206 0.131 0.245 0.148 0.13 0.157 0.130 0.151 0.093 0.121
4 0.113 0.131 0.108 0.176 0.14 0.104 0.120 0.179 0.165 0.121
5 0.093 0.119 0.127 0.157 0.13 0.148 0.196 0.160 0.103 0.162
6 0.093 0.131 0.118 0.102 0.13 0.096 0.196 0.113 0.165 0.152
7 0.165 0.107 0.167 0.111 0.07 0.165 0.098 0.094 0.206 0.141
>
> data(lindner)
> attach(lindner)
> lindner.ps <- glm(abcix ~ stent + height + female +
+ diabetic + acutemi + ejecfrac + ves1proc,
+ data = lindner, family = binomial)
> ps<-lindner.ps$fitted
> lindner.s5 <- as.numeric(cut(ps, quantile(ps, seq(0, 1, 1/5)),
+ include.lowest = TRUE, labels = FALSE))
> cat.psa(stent, abcix, lindner.s5, xlab = "stent")
$`treatment:stratum.proportions`
0:1 1:1 0:2 1:2 0:3 1:3 0:4 1:4 0:5 1:5
0 0.853 0.771 0.253 0.226 0.138 0.163 0.233 0.269 0.25 0.185
1 0.147 0.229 0.747 0.774 0.862 0.837 0.767 0.731 0.75 0.815
>
> lindner.s10 <- as.numeric(cut(ps, quantile(ps, seq(0, 1, 1/10)),
+ include.lowest = TRUE, labels = FALSE))
> cat.psa(ves1proc,abcix, lindner.s10, balance = TRUE, xlab = "ves1proc")
Histogram of Random Strata Balance. Press <enter> for next chart...
$`treatment:stratum.proportions`
0:1 1:1 0:2 1:2 0:3 1:3 0:4 1:4 0:5 1:5 0:6 1:6 0:7
0 0.017 0.071 0.000 0 0.000 0.000 0 0.000 0.000 0.000 0.000 0.000 0.000
1 0.983 0.929 0.946 1 0.857 0.969 1 0.917 0.897 0.814 0.889 0.815 0.583
2 0.000 0.000 0.054 0 0.143 0.031 0 0.083 0.103 0.186 0.111 0.185 0.375
3 0.000 0.000 0.000 0 0.000 0.000 0 0.000 0.000 0.000 0.000 0.000 0.042
4 0.000 0.000 0.000 0 0.000 0.000 0 0.000 0.000 0.000 0.000 0.000 0.000
5 0.000 0.000 0.000 0 0.000 0.000 0 0.000 0.000 0.000 0.000 0.000 0.000
1:7 0:8 1:8 0:9 1:9 0:10 1:10
0 0.000 0.000 0.000 0.000 0.000 0.000 0.000
1 0.486 0.263 0.195 0.364 0.379 0.000 0.253
2 0.500 0.737 0.732 0.545 0.460 0.444 0.396
3 0.014 0.000 0.073 0.091 0.161 0.444 0.198
4 0.000 0.000 0.000 0.000 0.000 0.111 0.143
5 0.000 0.000 0.000 0.000 0.000 0.000 0.011
>
> #Using a rpart tree for strata
> library(rpart)
> lindner.rpart<-rpart(abcix ~ stent + height + female + diabetic +
+ acutemi + ejecfrac + ves1proc, data=lindner, method="class")
> lindner.tree<-factor(lindner.rpart$where, labels = 1:6)
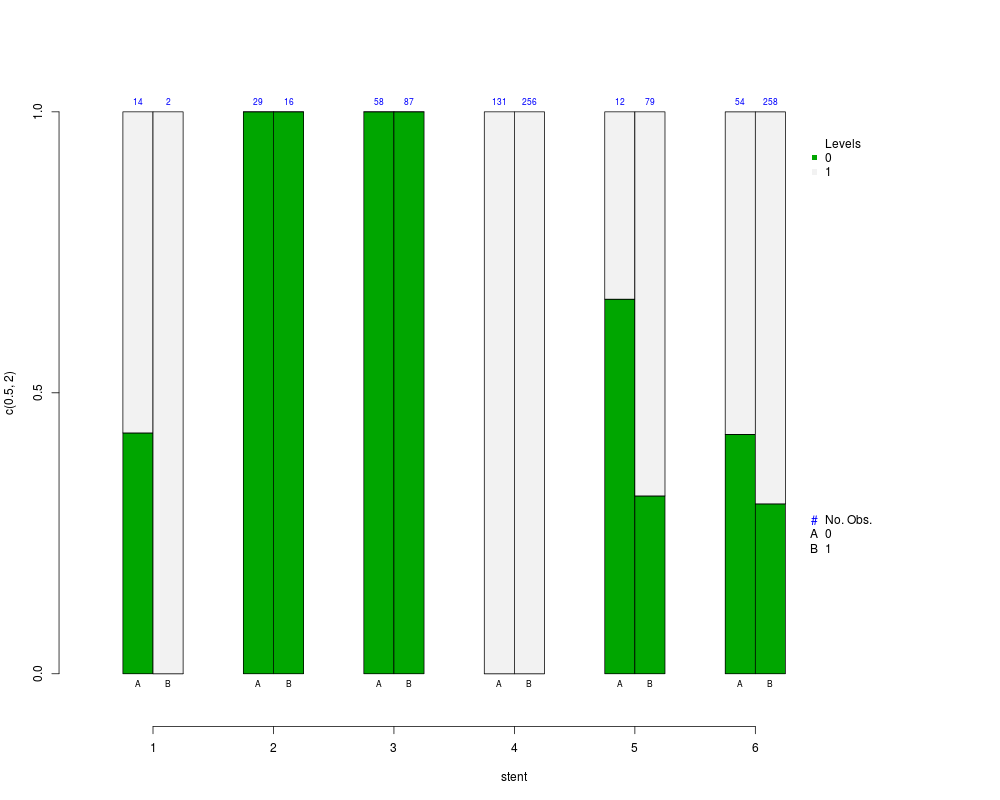
> cat.psa(stent, abcix, lindner.tree, xlab = "stent")
$`treatment:stratum.proportions`
0:1 1:1 0:2 1:2 0:3 1:3 0:4 1:4 0:5 1:5 0:6 1:6
0 0.429 0 1 1 1 1 0 0 0.667 0.316 0.426 0.302
1 0.571 1 0 0 0 0 1 1 0.333 0.684 0.574 0.698
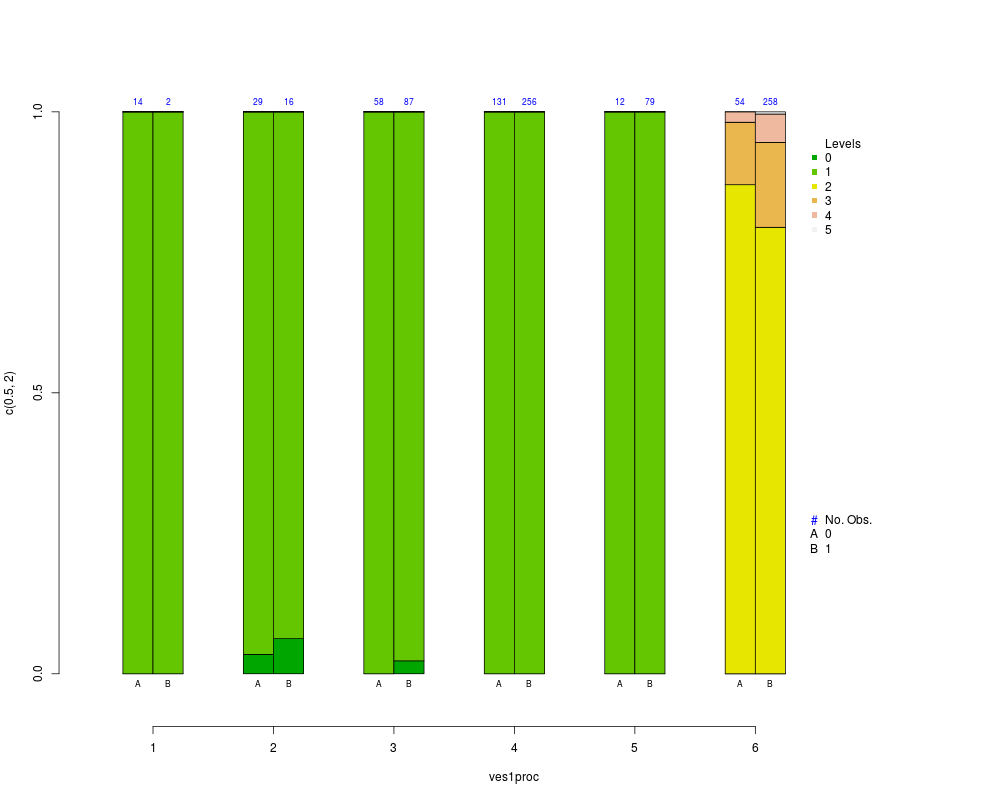
> cat.psa(ves1proc, abcix, lindner.tree, xlab = "ves1proc")
$`treatment:stratum.proportions`
0:1 1:1 0:2 1:2 0:3 1:3 0:4 1:4 0:5 1:5 0:6 1:6
0 0 0 0.034 0.062 0 0.023 0 0 0 0 0.000 0.000
1 1 1 0.966 0.938 1 0.977 1 1 1 1 0.000 0.000
2 0 0 0.000 0.000 0 0.000 0 0 0 0 0.870 0.795
3 0 0 0.000 0.000 0 0.000 0 0 0 0 0.111 0.151
4 0 0 0.000 0.000 0 0.000 0 0 0 0 0.019 0.050
5 0 0 0.000 0.000 0 0.000 0 0 0 0 0.000 0.004
>
>
>
>
>
> dev.off()
null device
1
>
|