Supported by Dr. Osamu Ogasawara and  . . |
|
Last data update: 2014.03.03 |
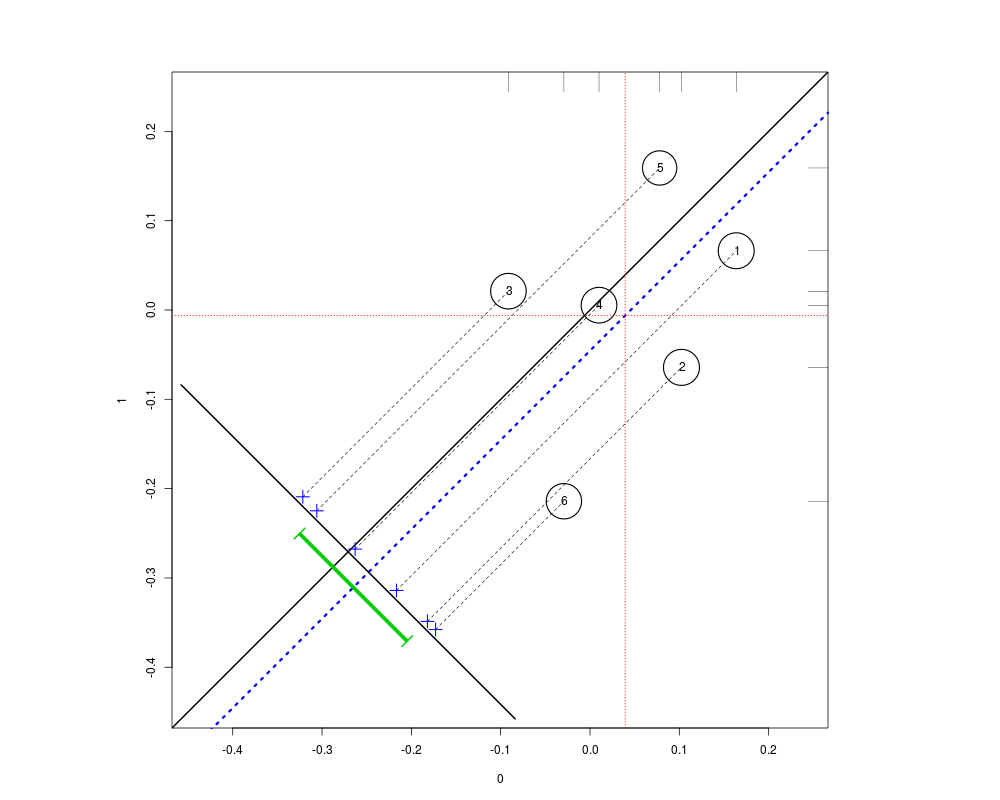
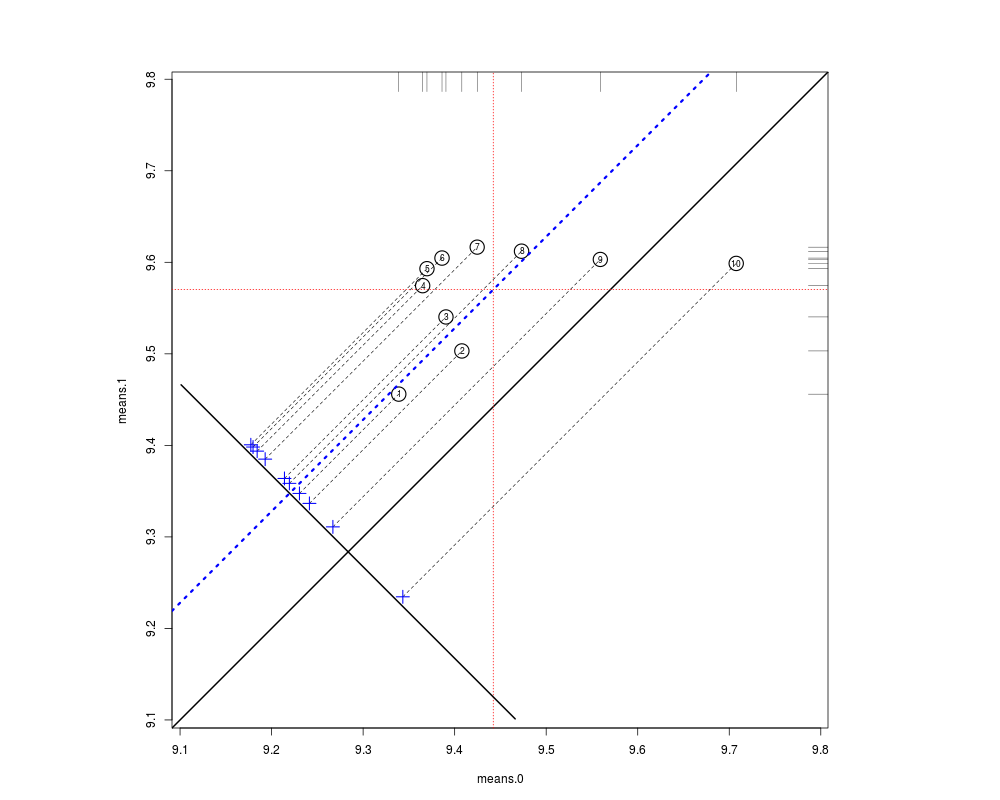
Generates a Propensity Score Assessment PlotDescriptionDisplays a graphic that summarizes outcomes in a propensity score analysis, based on strata that have been defined in the first Phase of a propensity score analysis (PSA). The graphic displays contributions of individual strata to the overall effect, weighing contributions of individual strata according to the relative sizes of the respective strata. The overall effect is plotted as a heavy dashed diagonal line that runs parallel to the identity diagonal. Usagecirc.psa(response, treatment = NULL, strata = NULL, summary = FALSE, statistic = "mean", trim = 0, revc = FALSE, confint = TRUE, sw = 0.4, ne = 0.5, inc = 0.25, pw = 0.4, lab = TRUE, labcex = 1, xlab = NULL, ylab = NULL, main = NULL) Arguments
DetailsA circle is plotted for each stratum, centered on the means for the treatment and
control groups (for the ValueGenerate a Propensity Assessment Plot, as well as numerical data for
Author(s)James E. Helmreich James.Helmreich@Marist.edu Robert M. Pruzek RMPruzek@yahoo.com See Also
Examples
##Random data with effect size 0
response <- rnorm(1000)
treatment <- sample(c(0,1), 1000, replace = TRUE)
strata <- sample(1:6, 1000, replace = TRUE)
circ.psa(response, treatment, strata)
##Random data with effect size -.2
response <- c(rnorm(500, 0, 12), rnorm(500, 6, 12))
treatment <- c(rep(0, 500), rep(1,500))
strata <- sample(1:5, 1000, replace = TRUE)
aaa <- cbind(response, treatment, strata)
circ.psa(aaa)
##Random data with effect size -2
response <- c(rt(100,3) * 2 + 20, rt(100,12) * 2 + 18)
treatment <- rep(c("A","B"), each = 100)
strata <- sample(c("X","Y","Z","U","V"), 200, replace = TRUE)
circ.psa(response, treatment, strata)
##Tree derived strata
library(rpart)
data(lindner)
attach(lindner)
lindner.rpart <- rpart(abcix ~ stent + height + female + diabetic +
acutemi + ejecfrac + ves1proc, data = lindner, method = "class")
lindner.tree<-factor(lindner.rpart$where, labels = 1:6)
circ.psa(log(cardbill), abcix, lindner.tree)
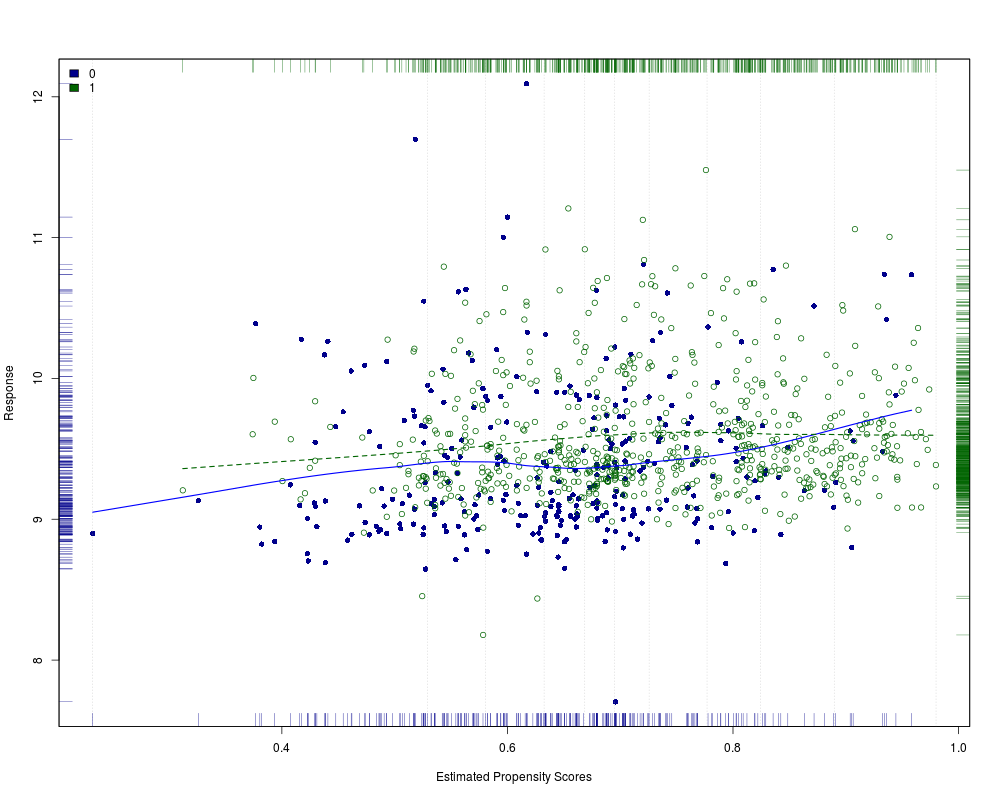
##Loess derived strata
lindner.ps <- glm(abcix ~ stent + height + female +
diabetic + acutemi + ejecfrac + ves1proc,
data = lindner, family = binomial)
ps<-lindner.ps$fitted
lindner.loess<-loess.psa(log(cardbill), abcix, ps)
circ.psa(lindner.loess$summary.strata[, 1:4], summary = TRUE,
inc = .1, labcex = .7)
Results
R version 3.3.1 (2016-06-21) -- "Bug in Your Hair"
Copyright (C) 2016 The R Foundation for Statistical Computing
Platform: x86_64-pc-linux-gnu (64-bit)
R is free software and comes with ABSOLUTELY NO WARRANTY.
You are welcome to redistribute it under certain conditions.
Type 'license()' or 'licence()' for distribution details.
R is a collaborative project with many contributors.
Type 'contributors()' for more information and
'citation()' on how to cite R or R packages in publications.
Type 'demo()' for some demos, 'help()' for on-line help, or
'help.start()' for an HTML browser interface to help.
Type 'q()' to quit R.
> library(PSAgraphics)
Loading required package: rpart
> png(filename="/home/ddbj/snapshot/RGM3/R_CC/result/PSAgraphics/circ.psa.Rd_%03d_medium.png", width=480, height=480)
> ### Name: circ.psa
> ### Title: Generates a Propensity Score Assessment Plot
> ### Aliases: circ.psa
> ### Keywords: hplot
>
> ### ** Examples
>
> ##Random data with effect size 0
> response <- rnorm(1000)
> treatment <- sample(c(0,1), 1000, replace = TRUE)
> strata <- sample(1:6, 1000, replace = TRUE)
> circ.psa(response, treatment, strata)
$summary.strata
n.0 n.1 means.0 means.1
1 85 70 -0.110720766 -0.064647869
2 82 75 -0.042281113 -0.001462146
3 77 79 0.062503932 -0.035089895
4 88 81 0.009802165 0.055194040
5 89 94 0.037413584 0.039239362
6 88 92 -0.015332939 0.165259989
$wtd.Mn.0
[1] -0.008305917
$wtd.Mn.1
[1] 0.03053139
$ATE
[1] 0.03883731
$se.wtd
[1] 0.06456456
$approx.t
[1] 0.6015267
$df
[1] 988
$CI.95
[1] -0.08786212 0.16553674
>
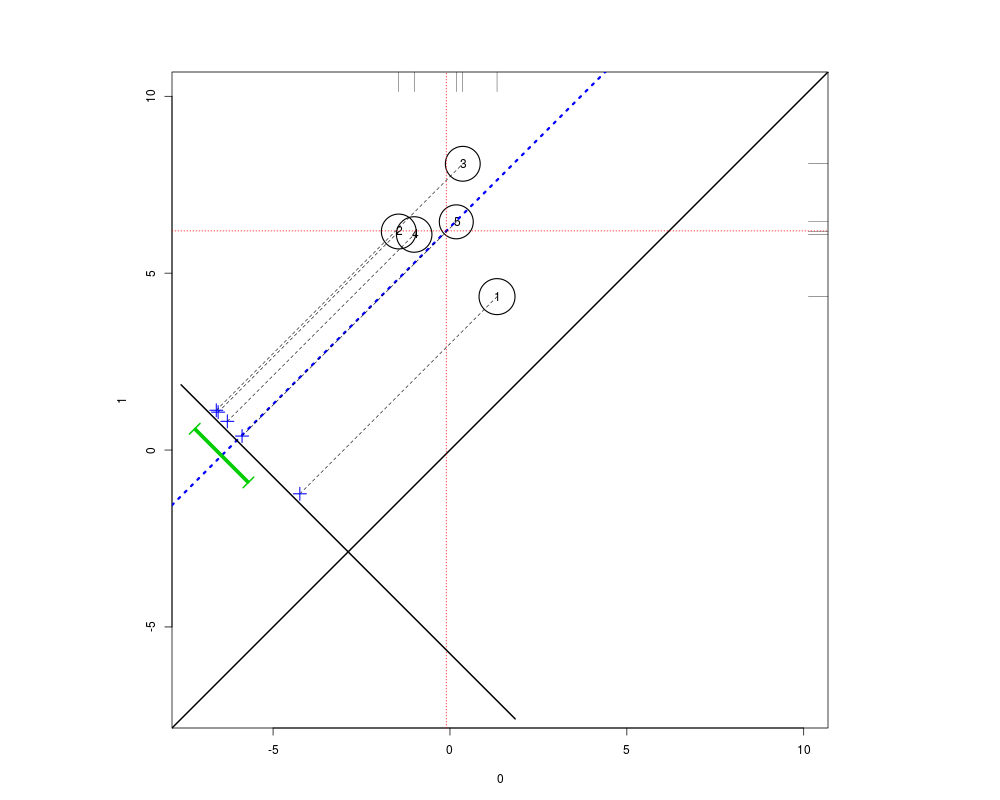
> ##Random data with effect size -.2
> response <- c(rnorm(500, 0, 12), rnorm(500, 6, 12))
> treatment <- c(rep(0, 500), rep(1,500))
> strata <- sample(1:5, 1000, replace = TRUE)
> aaa <- cbind(response, treatment, strata)
> circ.psa(aaa)
$summary.strata
n.0 n.1 means.0 means.1
1 92 98 -0.06963051 6.373472
2 95 106 -1.41461054 6.158869
3 112 90 -0.07121155 6.225004
4 98 103 -0.13458258 6.812454
5 103 103 -0.79562604 6.968158
$wtd.Mn.0
[1] -0.5029013
$wtd.Mn.1
[1] 6.511087
$ATE
[1] 7.013988
$se.wtd
[1] 0.7649973
$approx.t
[1] 9.168644
$df
[1] 990
$CI.95
[1] 5.512786 8.515190
>
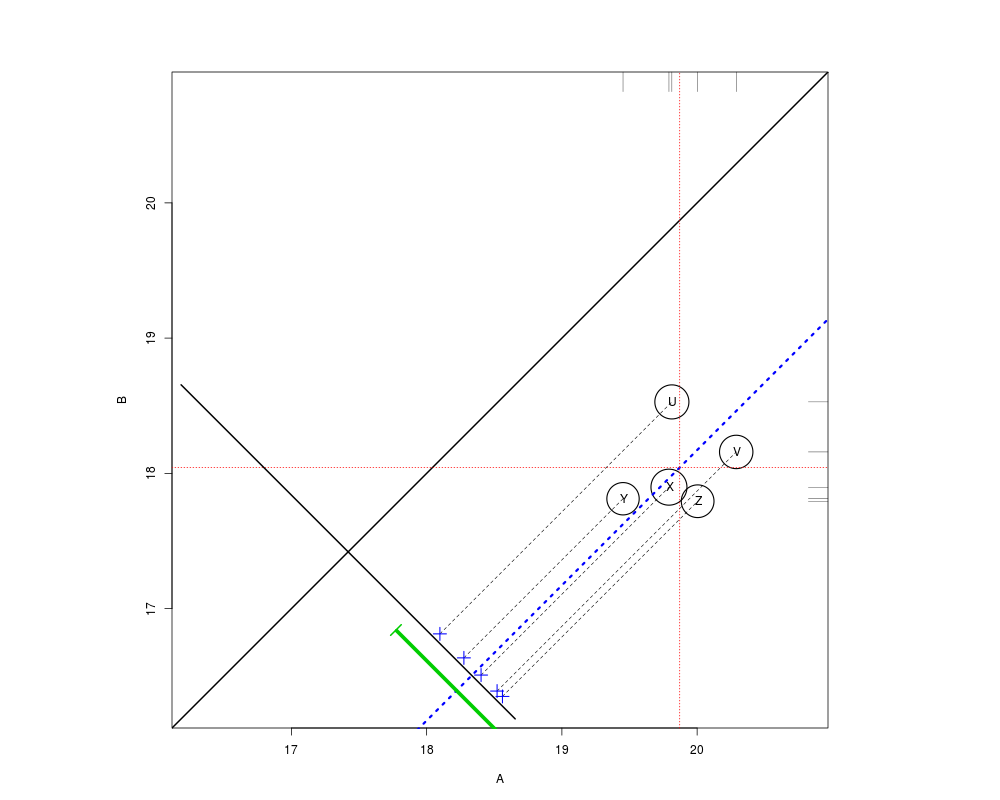
> ##Random data with effect size -2
> response <- c(rt(100,3) * 2 + 20, rt(100,12) * 2 + 18)
> treatment <- rep(c("A","B"), each = 100)
> strata <- sample(c("X","Y","Z","U","V"), 200, replace = TRUE)
> circ.psa(response, treatment, strata)
$summary.strata
n.A n.B means.A means.B
U 23 17 19.33781 16.96581
V 20 22 20.88521 17.16065
X 20 21 20.17085 17.52855
Y 22 13 20.44304 18.45437
Z 15 27 21.82959 18.24248
$wtd.Mn.A
[1] 20.55023
$wtd.Mn.B
[1] 17.65068
$ATE
[1] -2.89954
$se.wtd
[1] 0.4324621
$approx.t
[1] -6.704727
$df
[1] 190
$CI.95
[1] -3.752584 -2.046497
>
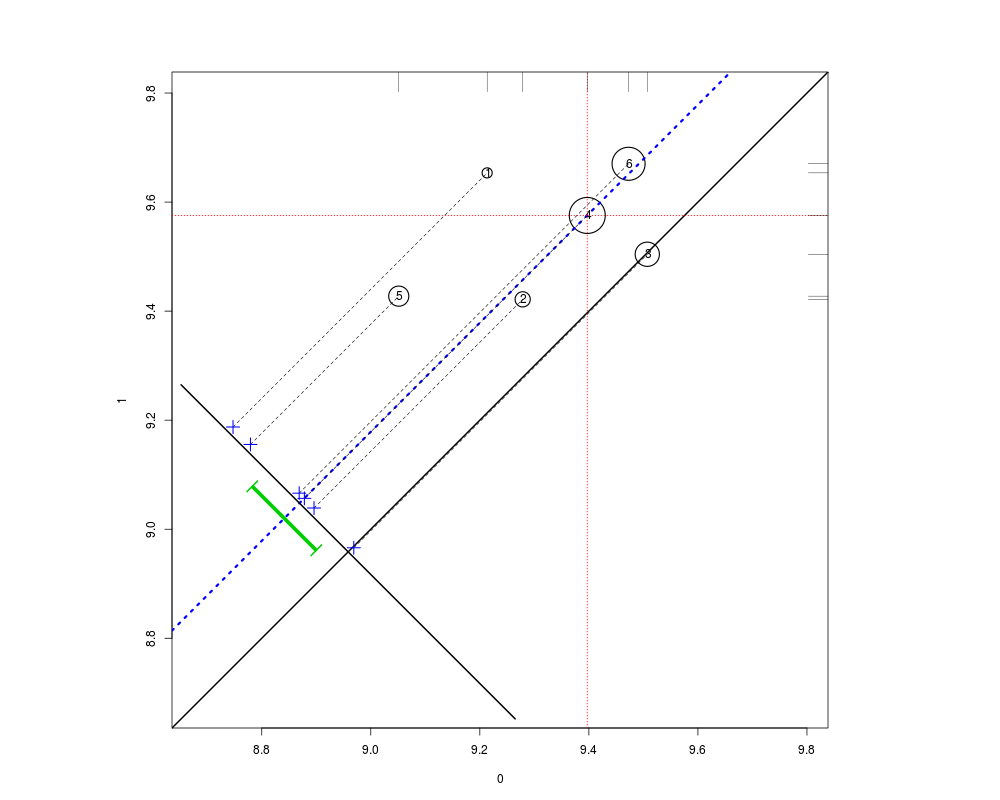
> ##Tree derived strata
> library(rpart)
> data(lindner)
> attach(lindner)
> lindner.rpart <- rpart(abcix ~ stent + height + female + diabetic +
+ acutemi + ejecfrac + ves1proc, data = lindner, method = "class")
> lindner.tree<-factor(lindner.rpart$where, labels = 1:6)
> circ.psa(log(cardbill), abcix, lindner.tree)
$summary.strata
n.0 n.1 means.0 means.1
1 14 2 9.213456 9.653571
2 29 16 9.278627 9.421610
3 58 87 9.507137 9.504301
4 131 256 9.397094 9.575469
5 12 79 9.051331 9.427481
6 54 258 9.472841 9.670249
$wtd.Mn.0
[1] 9.396949
$wtd.Mn.1
[1] 9.57558
$ATE
[1] 0.1786314
$se.wtd
[1] 0.05838647
$approx.t
[1] 3.059466
$df
[1] 984
$CI.95
[1] 0.06405511 0.29320771
>
> ##Loess derived strata
> lindner.ps <- glm(abcix ~ stent + height + female +
+ diabetic + acutemi + ejecfrac + ves1proc,
+ data = lindner, family = binomial)
> ps<-lindner.ps$fitted
> lindner.loess<-loess.psa(log(cardbill), abcix, ps)
> circ.psa(lindner.loess$summary.strata[, 1:4], summary = TRUE,
+ inc = .1, labcex = .7)
$summary.strata
counts.0 counts.1 means.0 means.1
1 58 42 9.338939 9.455965
2 37 63 9.407877 9.503125
3 35 64 9.390499 9.540272
4 40 60 9.365029 9.574458
5 29 70 9.369748 9.593021
6 36 65 9.386188 9.604613
7 24 74 9.424611 9.616556
8 19 82 9.473078 9.612104
9 11 87 9.559145 9.603100
10 9 91 9.707606 9.598751
$wtd.Mn.means.0
[1] 9.442172
$wtd.Mn.means.1
[1] 9.570121
$ATE
[1] 0.1279487
$se.wtd
NULL
$approx.t
numeric(0)
$df
[1] 976
$CI.95
[1] NA NA
>
>
>
>
> dev.off()
null device
1
>
|