Supported by Dr. Osamu Ogasawara and  . . |
|
Last data update: 2014.03.03 |
Plots the predicted PPIDescriptionPlots the predicted PPI in three different ways. Depending on the Usage
## S3 method for class 'Path2PPI'
plot(x, type = "ppi", multiple.edges = FALSE,
              scores = FALSE, species.colors = c(),
              vertices.opacity=0.8, use.identifiers=FALSE,
              protein.labels = NA, show.legend = TRUE,
              vertices.coordinates = NA, return.coordinates = FALSE,
              tkplot=FALSE,...)
Arguments
DetailsThe argument ValueIf NoteIf you want to export the plotted graph to postscript you have to consider
that the default font family is set to sans for vertex and edge labels.
Please change the default font family of postscript to sans before you
call the plot method: Author(s)Oliver Philipp MolBI-software@bioinformatik.uni-frankfurt.de See Also
Examples
data(ai) #Load test data set
ppi <- Path2PPI("Autophagy induction", "Podospora anserina", "5145")
ppi <- addReference(ppi, "Homo sapiens", "9606", human.ai.proteins,
human.ai.irefindex, pa2human.ai.homologs)
ppi <- addReference(ppi, "Saccharomyces cerevisiae (S288c)", "559292",
yeast.ai.proteins, yeast.ai.irefindex,
pa2yeast.ai.homologs)
ppi <- predictPPI(ppi,h.range=c(1e-60,1e-20))
#Plot the predicted PPI with the default settings and return
#the coordinates of the vertices
set.seed(12)
coordinates <- plot(ppi, return.coordinates=TRUE)
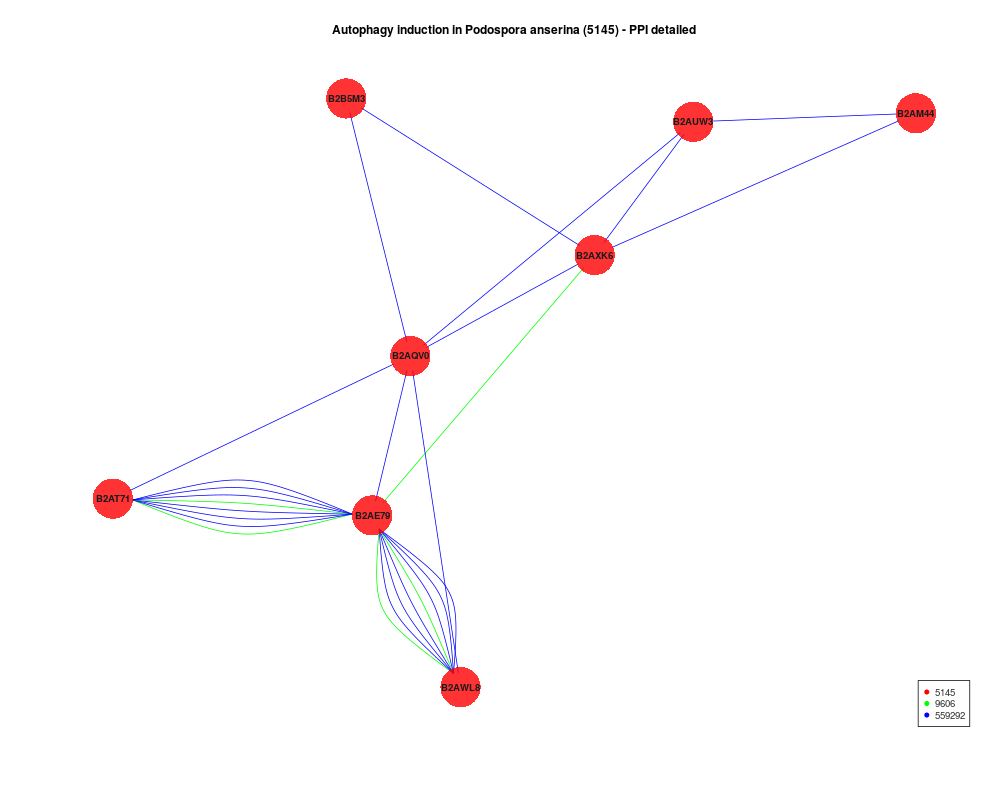
#Plot the predicted PPI and show each underlying reference interaction.
#Use different species specific colors. To compare both graphs,
#use the coordinates computed before
plot(ppi,multiple.edges=TRUE,vertices.coordinates=coordinates)
#Plot the corresponding hybrid network with predefined species colors.
#Also define some labels for the proteins of the target species.
#Keep in mind: You can not use the data in "coordinates" since
#the hybrid network consists of more vertices than the default PPI
set.seed(40)
target.labels<-c("B2AE79"="PaTOR","B2AXK6"="PaATG1",
"B2AUW3"="PaATG17","B2AM44"="PaATG11",
"B2AQV0"="PaATG13","B2B5M3"="PaVAC8")
species.colors <- c("5145"="red","9606"="blue","559292"="green")
plot(ppi,type="hybrid",species.colors=species.colors,
protein.labels=target.labels)
Results
R version 3.3.1 (2016-06-21) -- "Bug in Your Hair"
Copyright (C) 2016 The R Foundation for Statistical Computing
Platform: x86_64-pc-linux-gnu (64-bit)

R is free software and comes with ABSOLUTELY NO WARRANTY.
You are welcome to redistribute it under certain conditions.
Type 'license()' or 'licence()' for distribution details.

R is a collaborative project with many contributors.
Type 'contributors()' for more information and
'citation()' on how to cite R or R packages in publications.

Type 'demo()' for some demos, 'help()' for on-line help, or
'help.start()' for an HTML browser interface to help.
Type 'q()' to quit R.

> library(Path2PPI)
Loading required package: igraph

Attaching package: 'igraph'

The following objects are masked from 'package:stats':

    decompose, spectrum

The following object is masked from 'package:base':

    union

> png(filename="/home/ddbj/snapshot/RGM3/R_BC/result/Path2PPI/plot.Path2PPI.Rd_%03d_medium.png", width=480, height=480)
> ### Name: plot.Path2PPI
> ### Title: Plots the predicted PPI
> ### Aliases: plot.Path2PPI
>
> ### ** Examples
>
> data(ai) #Load test data set
>
> ppi <- Path2PPI("Autophagy induction", "Podospora anserina", "5145")
> ppi <- addReference(ppi, "Homo sapiens", "9606", human.ai.proteins,
+                     human.ai.irefindex, pa2human.ai.homologs)
Search for all relevant interactions:
0%--25%--50%--75%--100%
Remove irrelevant homologs.
> ppi <- addReference(ppi, "Saccharomyces cerevisiae (S288c)", "559292",
+                     yeast.ai.proteins, yeast.ai.irefindex,
+                     pa2yeast.ai.homologs)
Search for all relevant interactions:
0%--25%--50%--75%--100%
Remove irrelevant homologs.
>
> ppi <- predictPPI(ppi,h.range=c(1e-60,1e-20))
Begin with Homo sapiens
6 interactions processed. These lead to 5 interactions in target species.
-------------------------------
Begin with Saccharomyces cerevisiae (S288c)
15 interactions processed. These lead to 22 interactions in target species.
-------------------------------
Combine results to one single PPI.
A total of 13 putative interactions were predicted in target species.
>
> #Plot the predicted PPI with the default settings and return
> #the coordinates of the vertices
> set.seed(12)
> coordinates <- plot(ppi, return.coordinates=TRUE)
>
> #Plot the predicted PPI and show each underlying reference interaction.
> #Use different species specific colors. To compare both graphs,
> #use the coordinates computed before
> plot(ppi,multiple.edges=TRUE,vertices.coordinates=coordinates)
>
> #Plot the corresponding hybrid network with predefined species colors.
> #Also define some labels for the proteins of the target species.
> #Keep in mind: You can not use the data in "coordinates" since
> #the hybrid network consists of more vertices than the default PPI
> set.seed(40)
> target.labels<-c("B2AE79"="PaTOR","B2AXK6"="PaATG1",
+                 "B2AUW3"="PaATG17","B2AM44"="PaATG11",
+                 "B2AQV0"="PaATG13","B2B5M3"="PaVAC8")
> species.colors <- c("5145"="red","9606"="blue","559292"="green")
> plot(ppi,type="hybrid",species.colors=species.colors,
+ protein.labels=target.labels)
>
>
>
>
>
> dev.off()
null device
          1
>
|