Supported by Dr. Osamu Ogasawara and  . . |
|
Last data update: 2014.03.03 |
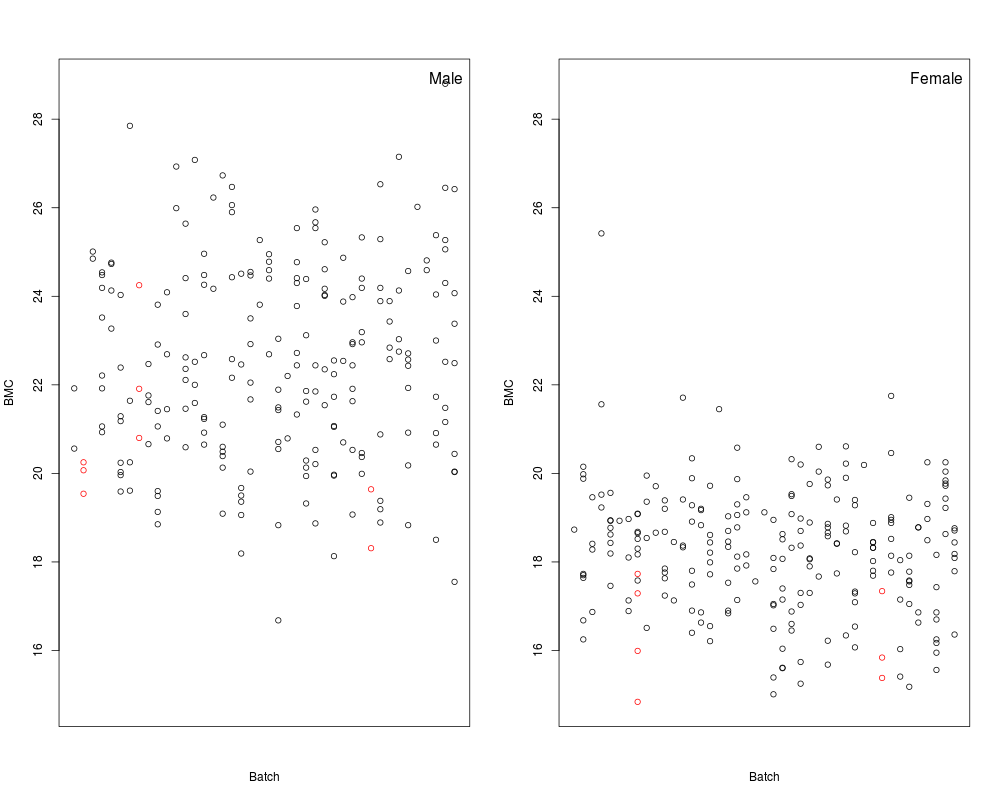
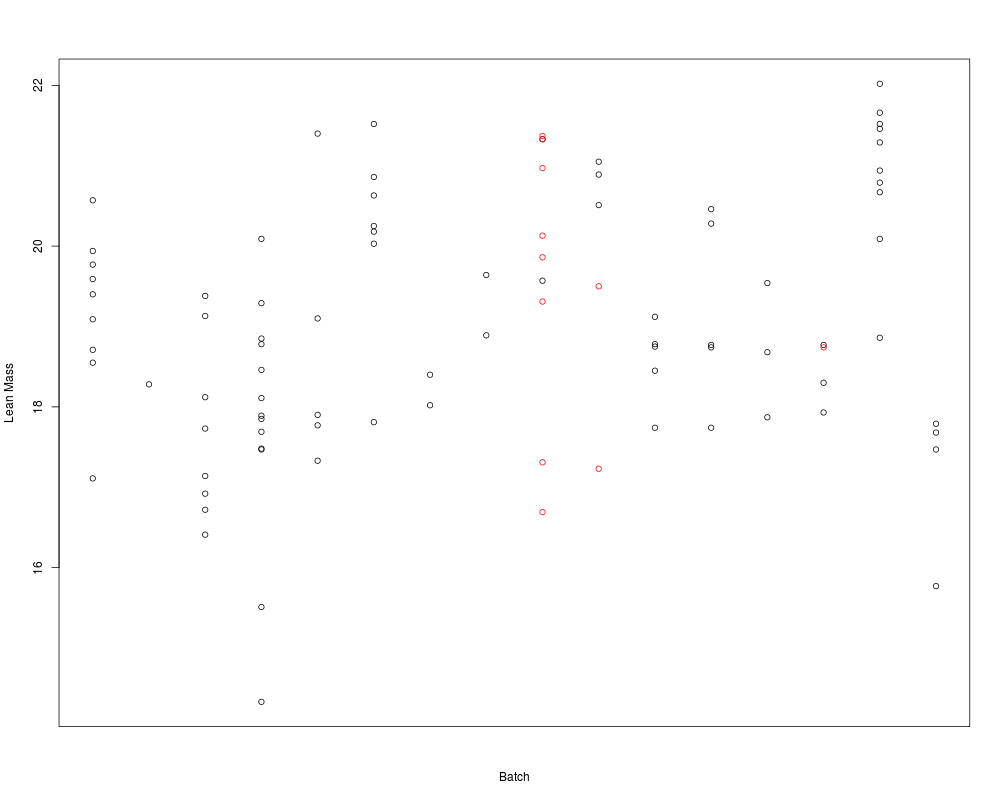
Method "scatterplotSexGenotypeBatchResult"DescriptionGraph function for the phenotypic dataset. Creates a scatterplot split by sex, genotype and batch. refGenotype data points are shown in black and the testGenotype data points are shown in red. It is based on PhenTestResult object. Note: the batches are not ordered with time but allow assessment of how the testGenotype data lie relative to the variation within the refGenotype data. Usage
scatterplotSexGenotypeBatchResult(phenTestResult,graphingName=NULL,outputMessages=TRUE)
Arguments
Author(s)Natalja Kurbatova, Natasha Karp, Jeremy Mason ReferencesKarp N, Melvin D, Sanger Mouse Genetics Project, Mott R (2012): Robust and Sensitive Analysis of Mouse Knockout Phenotypes. PLoS ONE 7(12): e52410. doi:10.1371/journal.pone.0052410 West B, Welch K, Galecki A (2007): Linear Mixed Models: A practical guide using statistical software New York: Chapman & Hall/CRC 353 p. See Also
Examples
    file <- system.file("extdata", "test1.csv", package="PhenStat")
    test <- PhenList(dataset=read.csv(file),
            testGenotype="Sparc/Sparc")
    result <- testDataset(test,
            depVariable="Lean.Mass")
    # box plot for dataset with two sexes: males and females
    scatterplotSexGenotypeBatchResult(result,
            graphingName="BMC" )

    file <- system.file("extdata", "test4.csv", package="PhenStat")
    test_1sex <- PhenList(dataset=read.csv(file),
            testGenotype="Mysm1/+")
    result_1sex <- testDataset(test_1sex,
            depVariable="Lean.Mass")
    # box plot for females only dataset
    scatterplotSexGenotypeBatchResult(result_1sex,
            graphingName="Lean Mass")
Results
R version 3.3.1 (2016-06-21) -- "Bug in Your Hair"
Copyright (C) 2016 The R Foundation for Statistical Computing
Platform: x86_64-pc-linux-gnu (64-bit)

R is free software and comes with ABSOLUTELY NO WARRANTY.
You are welcome to redistribute it under certain conditions.
Type 'license()' or 'licence()' for distribution details.

R is a collaborative project with many contributors.
Type 'contributors()' for more information and
'citation()' on how to cite R or R packages in publications.

Type 'demo()' for some demos, 'help()' for on-line help, or
'help.start()' for an HTML browser interface to help.
Type 'q()' to quit R.

> library(PhenStat)
> png(filename="/home/ddbj/snapshot/RGM3/R_BC/result/PhenStat/scatterplotSexGenotypeBatchResult.Rd_%03d_medium.png", width=480, height=480)
> ### Name: scatterplotSexGenotypeBatchResult
> ### Title: Method "scatterplotSexGenotypeBatchResult"
> ### Aliases: scatterplotSexGenotypeBatchResult
>
> ### ** Examples
>
>     file <- system.file("extdata", "test1.csv", package="PhenStat")
>     test <- PhenList(dataset=read.csv(file),
+             testGenotype="Sparc/Sparc")
Warning:
Dataset's column 'Assay.Date' has been renamed to 'Batch' and will be used for the batch effect modelling.

Information:
Dataset's 'Genotype' column has following values: '+/+', 'Sparc/Sparc'

Information:
Dataset's 'Sex' column has following value(s): 'Female', 'Male'

>     result <- testDataset(test,
+             depVariable="Lean.Mass")
Information:
Dependent variable: 'Lean.Mass'.

Information:
Perform all MM framework stages: startModel and finalModel.

Information:
Method: Mixed Model framework.

Information:
Equation: 'withWeight'.

Information:
Calculated values for model effects are: keepBatch=TRUE, keepEqualVariance=FALSE, keepWeight=TRUE, keepSex=TRUE, keepInteraction=FALSE.

>     # box plot for dataset with two sexes: males and females
>     scatterplotSexGenotypeBatchResult(result,
+             graphingName="BMC" )
>
>     file <- system.file("extdata", "test4.csv", package="PhenStat")
>     test_1sex <- PhenList(dataset=read.csv(file),
+             testGenotype="Mysm1/+")
Warning:
Dataset's column 'Assay.Date' has been renamed to 'Batch' and will be used for the batch effect modelling.

Information:
Dataset's 'Genotype' column has following values: '+/+', 'Mysm1/+'

Information:
Dataset's 'Sex' column has following value(s): 'Female'

>     result_1sex <- testDataset(test_1sex,
+             depVariable="Lean.Mass")
Information:
Dependent variable: 'Lean.Mass'.

Information:
Perform all MM framework stages: startModel and finalModel.

Information:
Method: Mixed Model framework.

Information:
Equation: 'withWeight'.

Information:
Calculated values for model effects are: keepBatch=TRUE, keepEqualVariance=TRUE, keepWeight=TRUE, keepSex=FALSE, keepInteraction=FALSE.

>     # box plot for females only dataset
>     scatterplotSexGenotypeBatchResult(result_1sex,
+             graphingName="Lean Mass")
>
>
>
>
>
> dev.off()
null device
          1
>
|