Supported by Dr. Osamu Ogasawara and  . . |
|
Last data update: 2014.03.03 |
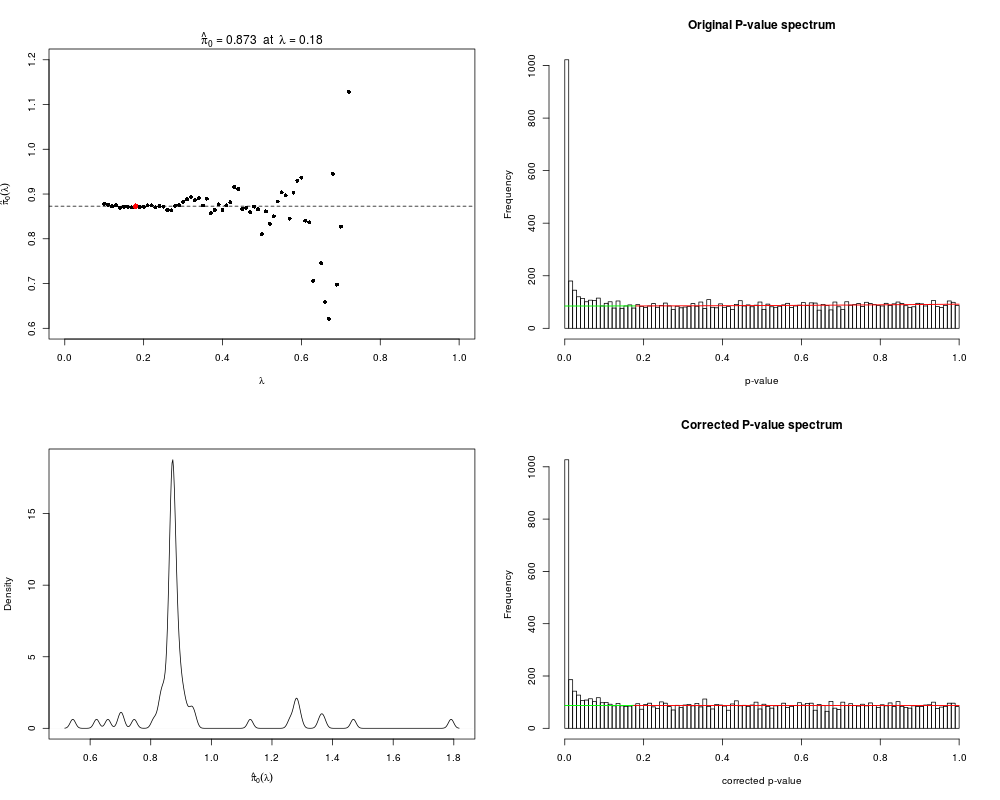
Level P-valuesDescriptionFunction to level out a P-value spectrum generated by the Polyfit extension of DESeq by fitting a quadratic function to the right hand portion of the spectrum, produce 'corrected' p-values and q-values using an adapted version of the Storey-Tibsharini procedure UsagelevelPValues(oldPvals, plot = FALSE) Arguments
Details
ValueList containing
Author(s)Conrad Burden ReferencesBurden, C.J., Qureshi, S. and Wilson, S.R. (2014). Error estimates for the analysis of differential expression from RNA-seq count data, PeerJ PrePrints 2:e400v1. Examples
cds <- makeExampleCountDataSet()
cds <- estimateSizeFactors( cds )
cds <- estimateDispersions( cds )
nbTPolyfit <- pfNbinomTest( cds, "A", "B" )
lP <- levelPValues(nbTPolyfit$pval, plot=TRUE)
pvalTab <- cbind(origPval=nbTPolyfit$pval, correctedPval=lP$pValueCorr)
cat("\n Original and corrected P-values from DESeq \n")
head(pvalTab)
Results
R version 3.3.1 (2016-06-21) -- "Bug in Your Hair"
Copyright (C) 2016 The R Foundation for Statistical Computing
Platform: x86_64-pc-linux-gnu (64-bit)

R is free software and comes with ABSOLUTELY NO WARRANTY.
You are welcome to redistribute it under certain conditions.
Type 'license()' or 'licence()' for distribution details.

R is a collaborative project with many contributors.
Type 'contributors()' for more information and
'citation()' on how to cite R or R packages in publications.

Type 'demo()' for some demos, 'help()' for on-line help, or
'help.start()' for an HTML browser interface to help.
Type 'q()' to quit R.

> library(Polyfit)
Loading required package: DESeq
Loading required package: BiocGenerics
Loading required package: parallel

Attaching package: 'BiocGenerics'

The following objects are masked from 'package:parallel':

    clusterApply, clusterApplyLB, clusterCall, clusterEvalQ,
    clusterExport, clusterMap, parApply, parCapply, parLapply,
    parLapplyLB, parRapply, parSapply, parSapplyLB

The following objects are masked from 'package:stats':

    IQR, mad, xtabs

The following objects are masked from 'package:base':

    Filter, Find, Map, Position, Reduce, anyDuplicated, append,
    as.data.frame, cbind, colnames, do.call, duplicated, eval, evalq,
    get, grep, grepl, intersect, is.unsorted, lapply, lengths, mapply,
    match, mget, order, paste, pmax, pmax.int, pmin, pmin.int, rank,
    rbind, rownames, sapply, setdiff, sort, table, tapply, union,
    unique, unsplit

Loading required package: Biobase
Welcome to Bioconductor

    Vignettes contain introductory material; view with
    'browseVignettes()'. To cite Bioconductor, see
    'citation("Biobase")', and for packages 'citation("pkgname")'.

Loading required package: locfit
locfit 1.5-9.1 	 2013-03-22
Loading required package: lattice
    Welcome to 'DESeq'. For improved performance, usability and
    functionality, please consider migrating to 'DESeq2'.
> png(filename="/home/ddbj/snapshot/RGM3/R_BC/result/Polyfit/levelPValues.Rd_%03d_medium.png", width=480, height=480)
> ### Name: levelPValues
> ### Title: Level P-values
> ### Aliases: levelPValues
>
> ### ** Examples
>
> cds <- makeExampleCountDataSet()
> cds <- estimateSizeFactors( cds )
> cds <- estimateDispersions( cds )
> nbTPolyfit <- pfNbinomTest( cds, "A", "B" )
> lP <- levelPValues(nbTPolyfit$pval, plot=TRUE)
> pvalTab <- cbind(origPval=nbTPolyfit$pval, correctedPval=lP$pValueCorr)
> cat("\n Original and corrected P-values from DESeq \n")

 Original and corrected P-values from DESeq
> head(pvalTab)
      origPval correctedPval
[1,] 0.3964267     0.4014699
[2,] 0.2538544     0.2588851
[3,] 0.3271456     0.3323716
[4,] 0.2188856     0.2236565
[5,] 0.7232142     0.7249179
[6,] 0.4948823     0.4992047
>
>
>
>
>
> dev.off()
null device
          1
>
|