Supported by Dr. Osamu Ogasawara and  . . |
|
Last data update: 2014.03.03 |
Prize: an R package for prioritization estimation based on analytic hierarchy processDescriptionThe Prize package is a decision analysis tool based on Analytic Hierarchy Process (AHP), which provides a logical framework to rank and prioritize a group of alternatives. Once the decision makers have their list of available options (alternatives) and defined their criteria for prioritization, the Prize package allows aggregation of individual judgements against each criterion into a group judgement, then use these judgements to calculate final ahp weight for ranking. The Prize package also provides visualizarion tools to illustrate the problem hierarchy, the criteria weights and final ranking. Author(s)Daryanaz Dargahi <daryanazdargahi@gmail.com> ReferencesSaaty, T. L. (1977) A scaling methods for priorities in hierarchical structure. Journal of Mathematical Psychology, 15, 234-281. T.L. Saaty. The Analytic Hierarchy Process, Planning, Piority Setting, Re- source Allocation. McGraw-Hill, New york, 1980. E. Forman and K. Peniwati. Aggregating individual judgments and priorities with the analytic hierarchy process. European Journal of Operational Research, 108(1):165-169, 1998. J.C. Gower. Some distance properties of latent root and vector methods used in multivariate analysis. Biometrika, 53(3/4):pp. 325-338, 1966. Examples
########################################
## aggregation of individual opinions
########################################
mat = matrix(nrow = 4, ncol = 1, data = NA)
mat[,1] = c(system.file('extdata','ind1.tsv',package = 'Prize'),
system.file('extdata','ind2.tsv',package = 'Prize'),
system.file('extdata','ind3.tsv',package = 'Prize'),
system.file('extdata','ind4.tsv',package = 'Prize'))
rownames(mat) = c('ind1','ind2','ind3', 'ind4')
colnames(mat) = c('individual_judgement')
# non-weighted AIJ
res = gaggregate(srcfile = mat, method = 'geometric', simulation = 500)
########################################
## Estimating idealised prioritise
## Rating AHP
########################################
category_pcm = read.delim(system.file('extdata','number.tsv', package = 'Prize')
, sep = '\t', header = TRUE, row.names = 1)
alt_mat = read.delim(system.file('extdata','numEpitope_alternative_category.tsv',
package = 'Prize'), sep = '\t', header = FALSE)
rate = rating(category_pcm, alt_mat, simulation = 500)
########################################
## Prioritization estimation using AHP
########################################
mat <- matrix(nrow = 7, ncol = 3, data = NA)
mat[,1] <- c('0', '1','2','3','4','4.1','4.2')
mat[,2] <- c('Prioritization_of_DE_genes','Tumor_expression','Normal_expression',
'Frequency', 'Epitopes', 'Number_of_epitopes', 'Size_of_epitopes')
mat[,3] <- c(system.file('extdata','aggreg.judgement.tsv',package = 'Prize'),
system.file('extdata','tumor.PCM.tsv',package = 'Prize'),
system.file('extdata','normal.PCM.tsv',package = 'Prize'),
system.file('extdata','freq.PCM.tsv',package = 'Prize'),
system.file('extdata','epitope.PCM.tsv',package = 'Prize'),
system.file('extdata','epitopeNum.PCM.tsv',package = 'Prize'),
system.file('extdata','epitopeLength.PCM.tsv',package = 'Prize'))
# prioritization pipeline
prioritization <- pipeline(mat, model = 'relative', simulation = 500)
########################################
## visualizaion
########################################
# visualizing individal opinion consistency ratio
crplot(ICR(res), angle = 45)
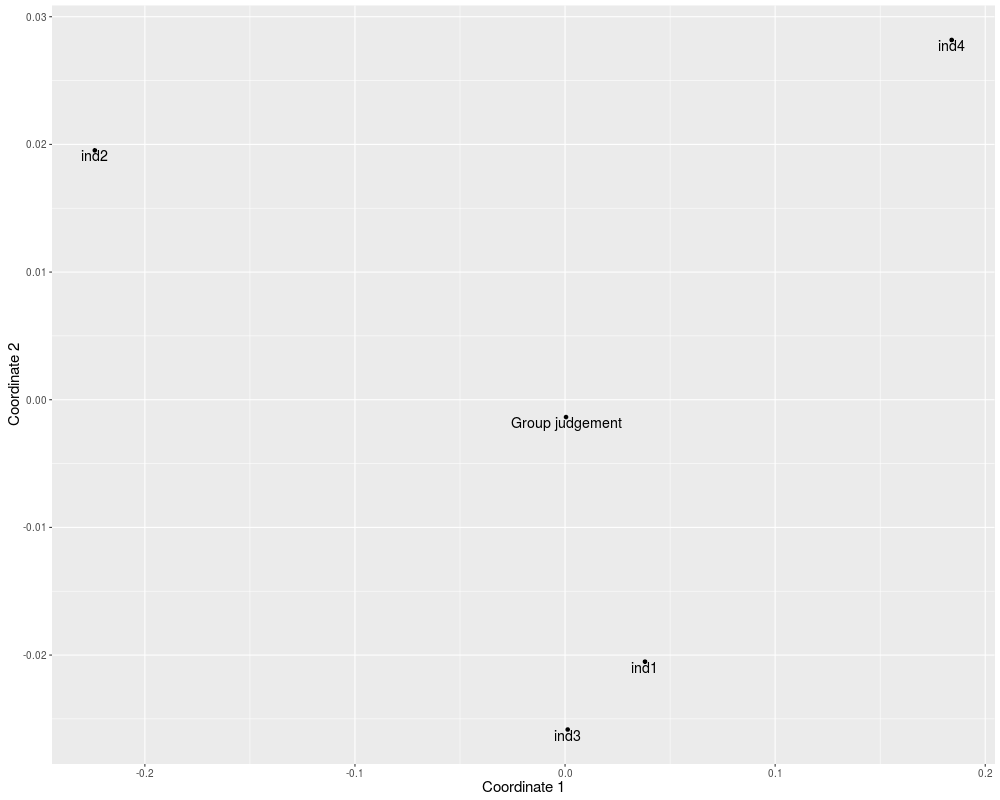
# visualizing the distance among individual opinion and aggregated group judgment
dplot(IP(res))
# visualizing problem hierarchy
ahplot(ahp_plot(prioritization), fontsize = 0.7, cradx = 0.11 ,sradx = 0.12,
cirx= 0.18, ciry = 0.07, dist = 0.06)
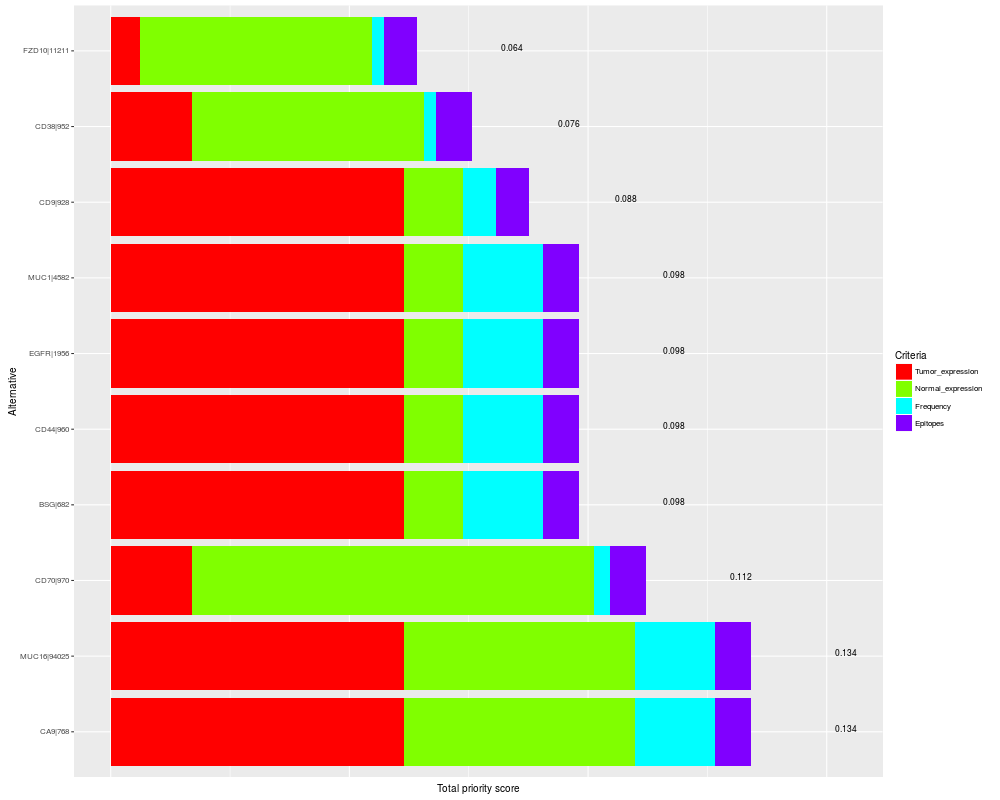
# visualizing prioritized alternatives
rainbowplot(rainbow_plot(prioritization)$criteria_rainbowplot, xcex = 3)
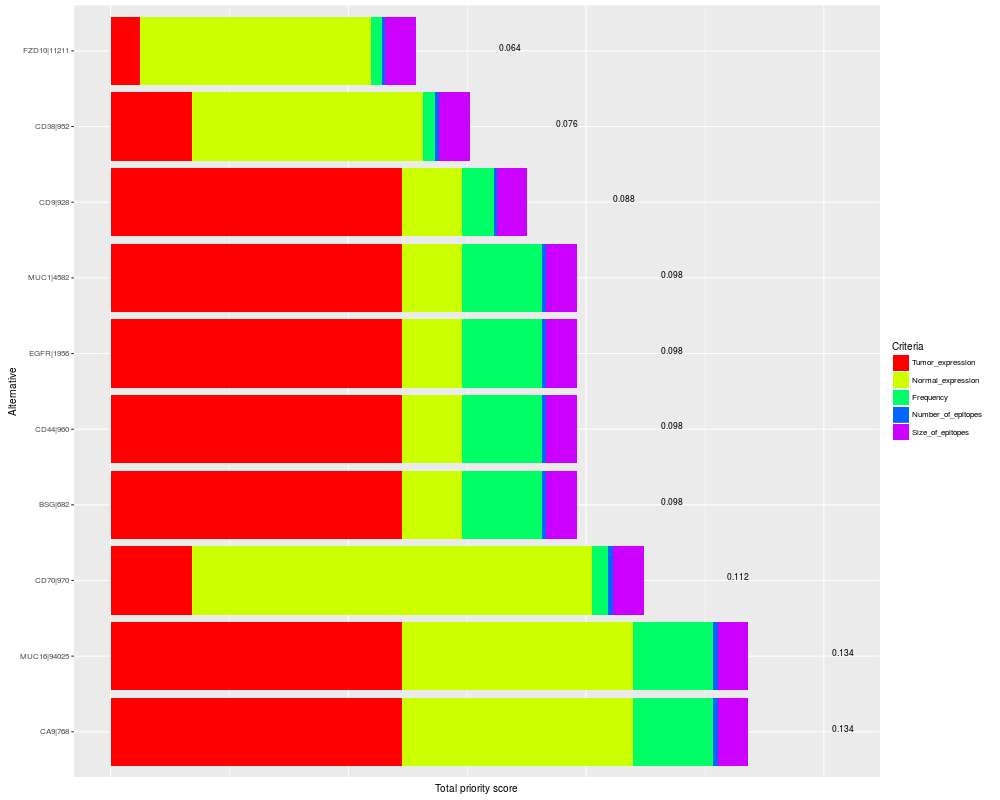
rainbowplot(rainbow_plot(prioritization)$subcriteria_rainbowplot, xcex = 3)
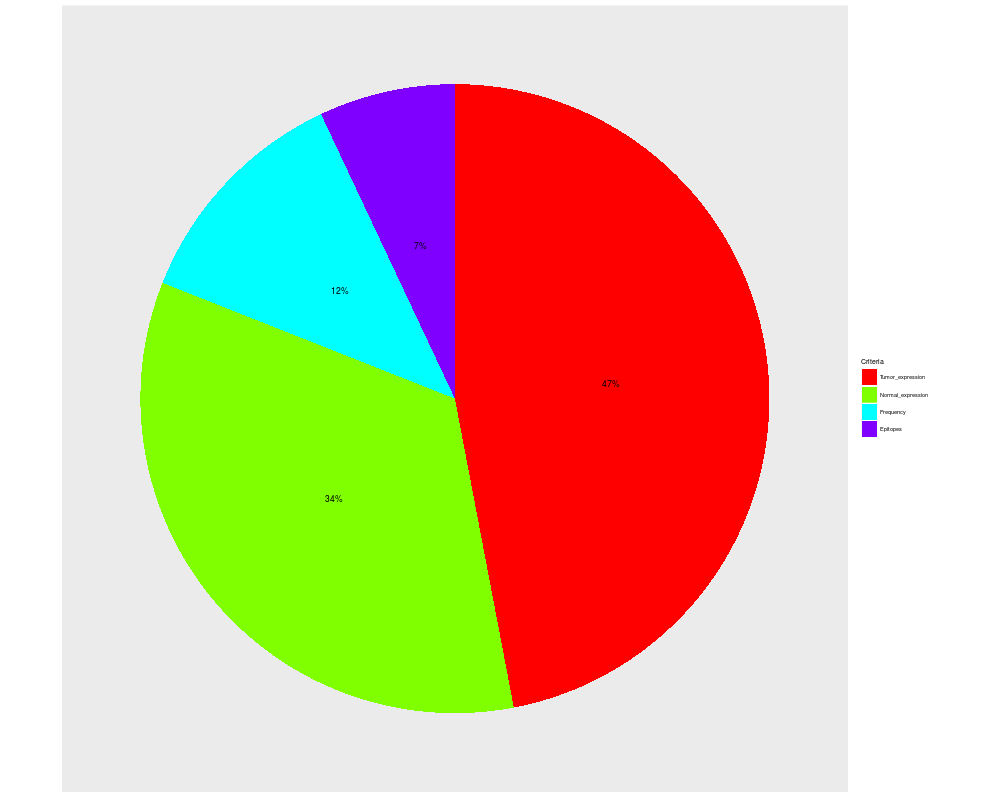
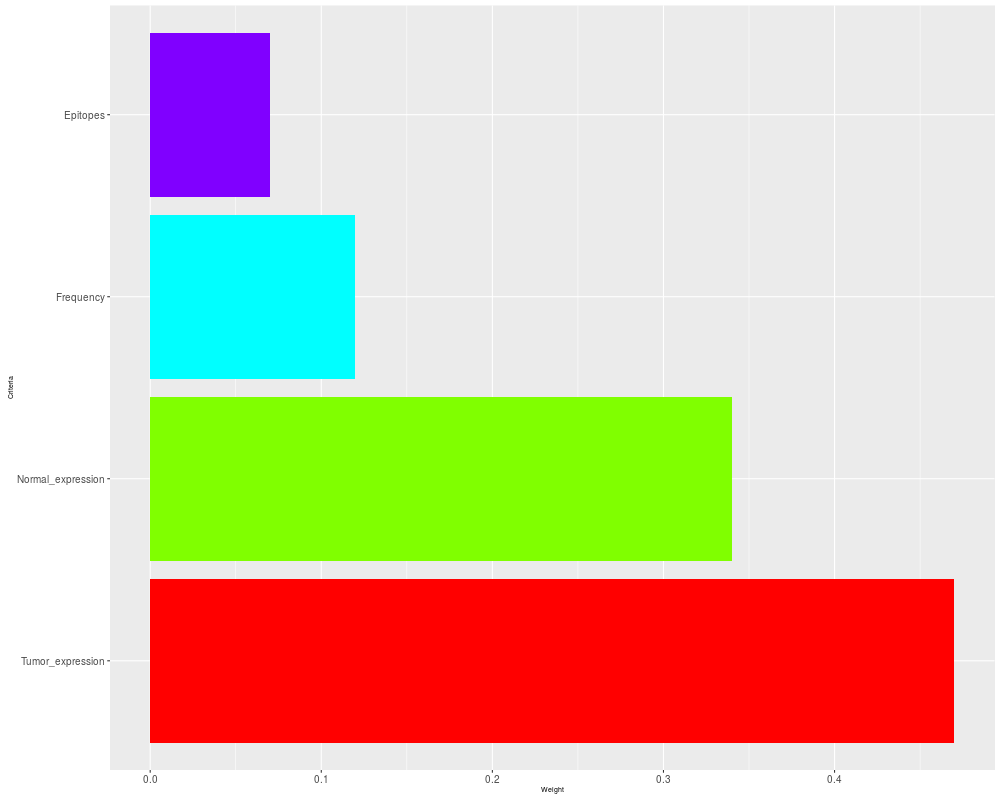
# visualizing criteria/subcriteria score
wplot(weight_plot(prioritization)$criteria_wplot, type = 'pie',
fontsize = 7, pcex = 3)
wplot(weight_plot(prioritization)$criteria_wplot, type = 'bar',
fontsize = 7, pcex = 3, xlab = 'Weight', ylab = 'Criteria')
Results
R version 3.3.1 (2016-06-21) -- "Bug in Your Hair"
Copyright (C) 2016 The R Foundation for Statistical Computing
Platform: x86_64-pc-linux-gnu (64-bit)

R is free software and comes with ABSOLUTELY NO WARRANTY.
You are welcome to redistribute it under certain conditions.
Type 'license()' or 'licence()' for distribution details.

R is a collaborative project with many contributors.
Type 'contributors()' for more information and
'citation()' on how to cite R or R packages in publications.

Type 'demo()' for some demos, 'help()' for on-line help, or
'help.start()' for an HTML browser interface to help.
Type 'q()' to quit R.

> library(Prize)
> png(filename="/home/ddbj/snapshot/RGM3/R_BC/result/Prize/Prize-package.Rd_%03d_medium.png", width=480, height=480)
> ### Name: Prize-package
> ### Title: Prize: an R package for prioritization estimation based on
> ###   analytic hierarchy process
> ### Aliases: Prize-package Prize
> ### Keywords: Analytic Hierarchy Process Prioritization Group decision
> ###   making
>
> ### ** Examples
>
> ########################################
> ## aggregation of individual opinions
> ########################################
> mat = matrix(nrow = 4, ncol = 1, data = NA)
> mat[,1] = c(system.file('extdata','ind1.tsv',package = 'Prize'),
+             system.file('extdata','ind2.tsv',package = 'Prize'),
+             system.file('extdata','ind3.tsv',package = 'Prize'),
+             system.file('extdata','ind4.tsv',package = 'Prize'))
> rownames(mat) = c('ind1','ind2','ind3', 'ind4')
> colnames(mat) = c('individual_judgement')
>
> # non-weighted AIJ
> res = gaggregate(srcfile = mat, method = 'geometric', simulation = 500)
Reading individual judgements.
Aggregating individual judgements with geometric mean (AIJ).
Computing group consistency ratio (GCR).
Computing consensus index (CI).
>
> ########################################
> ## Estimating idealised prioritise
> ## Rating AHP
> ########################################
> category_pcm = read.delim(system.file('extdata','number.tsv', package = 'Prize')
+                           , sep = '\t', header = TRUE, row.names = 1)
> alt_mat = read.delim(system.file('extdata','numEpitope_alternative_category.tsv',
+                     package = 'Prize'), sep = '\t', header = FALSE)
> rate = rating(category_pcm, alt_mat, simulation = 500)
>
> ########################################
> ## Prioritization estimation using AHP
> ########################################
> mat <- matrix(nrow = 7, ncol = 3, data = NA)
> mat[,1] <- c('0', '1','2','3','4','4.1','4.2')
> mat[,2] <- c('Prioritization_of_DE_genes','Tumor_expression','Normal_expression',
+              'Frequency', 'Epitopes', 'Number_of_epitopes', 'Size_of_epitopes')
> mat[,3] <- c(system.file('extdata','aggreg.judgement.tsv',package = 'Prize'),
+              system.file('extdata','tumor.PCM.tsv',package = 'Prize'),
+              system.file('extdata','normal.PCM.tsv',package = 'Prize'),
+              system.file('extdata','freq.PCM.tsv',package = 'Prize'),
+              system.file('extdata','epitope.PCM.tsv',package = 'Prize'),
+              system.file('extdata','epitopeNum.PCM.tsv',package = 'Prize'),
+              system.file('extdata','epitopeLength.PCM.tsv',package = 'Prize'))
>
> # prioritization pipeline
> prioritization <- pipeline(mat, model = 'relative', simulation = 500)
0 Prioritization_of_DE_genes is processed.
1 Tumor_expression is processed.
2 Normal_expression is processed.
3 Frequency is processed.
4 Epitopes is processed.
4.1 Number_of_epitopes is processed.
4.2 Size_of_epitopes is processed.
>
> ########################################
> ## visualizaion
> ########################################
> # visualizing individal opinion consistency ratio
> crplot(ICR(res), angle = 45)
>
> # visualizing the distance among individual opinion and aggregated group judgment
> dplot(IP(res))
>
> # visualizing problem hierarchy
> ahplot(ahp_plot(prioritization), fontsize = 0.7, cradx = 0.11 ,sradx = 0.12,
+        cirx= 0.18, ciry = 0.07, dist = 0.06)
>
> # visualizing prioritized alternatives
> rainbowplot(rainbow_plot(prioritization)$criteria_rainbowplot, xcex = 3)
> rainbowplot(rainbow_plot(prioritization)$subcriteria_rainbowplot, xcex = 3)
>
> # visualizing criteria/subcriteria score
> wplot(weight_plot(prioritization)$criteria_wplot, type = 'pie',
+       fontsize = 7, pcex = 3)
> wplot(weight_plot(prioritization)$criteria_wplot, type = 'bar',
+       fontsize = 7, pcex = 3, xlab = 'Weight', ylab = 'Criteria')
>
>
>
>
>
>
> dev.off()
null device
          1
>
|