a character matrix, where the first column specifies the hierarchy order. The second and third columns include the ID of decisison elements and ahp weights (optional), respectively (See the example below).
fontsize
the font size of characters.
cradx,crady
the horizontal and vertical radius of the criteria box, respectively.
sradx,srady
the horizontal and vertical radius of the subcriteria box, respectively.
cirx,ciry
the horizontal and vertical radius of the goal
gcol,ccol,scol
the filling color of the goal, criteria, and subcriteria boxes, respectively.
lcol
the line color surrounding the goal, criteria, and subcriteria boxes.
dist
the distance between the weights and the tree edges.
digit
the number of digits after decimal point to be shown on the arrows.
main
a character string as the plot title
Value
An object created by 'diagram'.
Author(s)
Daryanaz Dargahi
Examples
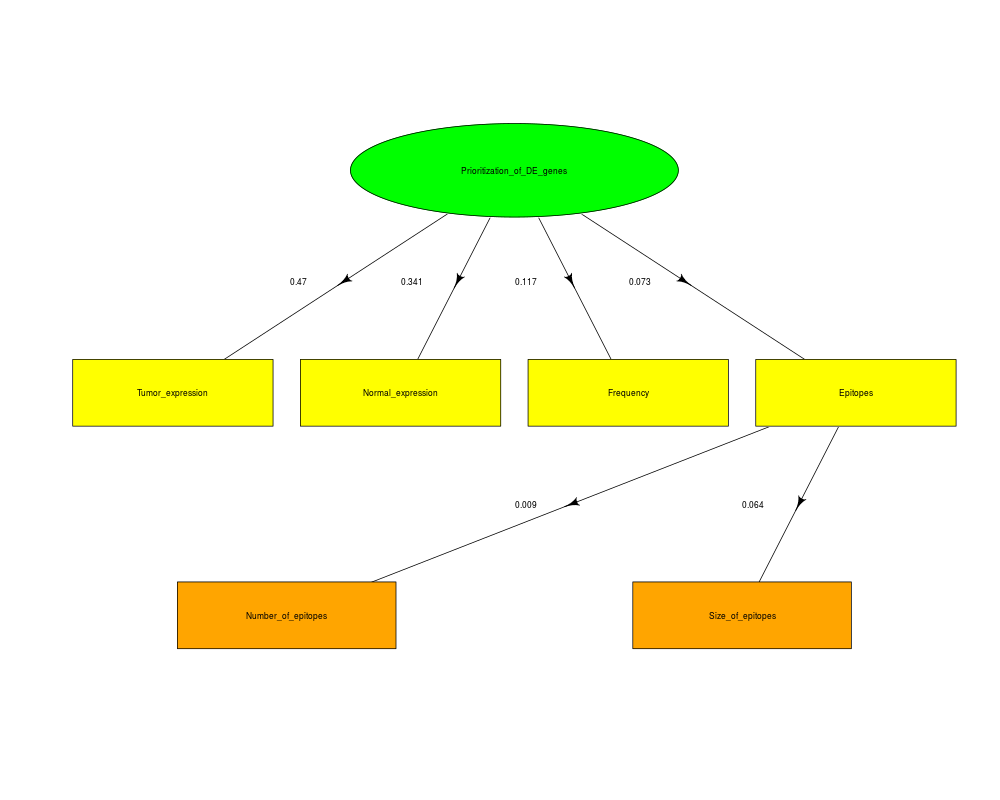
mat <- matrix(nrow = 7, ncol = 2, data = NA)
mat[,1] <- c('0', '1','2','3','4','4.1','4.2')
mat[,2] <- c('Prioritization_of_DE_genes','Tumor_expression','Normal_expression',
'Frequency', 'Epitopes', 'Number_of_epitopes', 'Size_of_epitopes')

# plotting a problem hierarchy
ahplot(mat, fontsize = 0.7, cradx = 0.11 ,sradx = 0.12, cirx= 0.18, ciry = 0.07)

# plotting a problem hierarchy with AHP weights shown on the edges of the graph
mat <- cbind(mat, c(1, 0.470, 0.341, 0.117, 0.073, 0.009, 0.064))
ahplot(mat, fontsize = 0.7, cradx = 0.11 ,sradx = 0.12, cirx= 0.18, ciry = 0.07)
Results
R version 3.3.1 (2016-06-21) -- "Bug in Your Hair"
Copyright (C) 2016 The R Foundation for Statistical Computing
Platform: x86_64-pc-linux-gnu (64-bit)

R is free software and comes with ABSOLUTELY NO WARRANTY.
You are welcome to redistribute it under certain conditions.
Type 'license()' or 'licence()' for distribution details.

R is a collaborative project with many contributors.
Type 'contributors()' for more information and
'citation()' on how to cite R or R packages in publications.

Type 'demo()' for some demos, 'help()' for on-line help, or
'help.start()' for an HTML browser interface to help.
Type 'q()' to quit R.

> library(Prize)
> png(filename="/home/ddbj/snapshot/RGM3/R_BC/result/Prize/ahplot.Rd_%03d_medium.png", width=480, height=480)
> ### Name: ahplot
> ### Title: ahplot
> ### Aliases: ahplot
>
> ### ** Examples
>
> mat <- matrix(nrow = 7, ncol = 2, data = NA)
> mat[,1] <- c('0', '1','2','3','4','4.1','4.2')
> mat[,2] <- c('Prioritization_of_DE_genes','Tumor_expression','Normal_expression',
+ 'Frequency', 'Epitopes', 'Number_of_epitopes', 'Size_of_epitopes')
>
> # plotting a problem hierarchy
> ahplot(mat, fontsize = 0.7, cradx = 0.11 ,sradx = 0.12, cirx= 0.18, ciry = 0.07)
>
> # plotting a problem hierarchy with AHP weights shown on the edges of the graph
> mat <- cbind(mat, c(1, 0.470, 0.341, 0.117, 0.073, 0.009, 0.064))
> ahplot(mat, fontsize = 0.7, cradx = 0.11 ,sradx = 0.12, cirx= 0.18, ciry = 0.07)
>
>
>
>
>
> dev.off()
null device
          1
>
 .
.