Supported by Dr. Osamu Ogasawara and  . . |
|
Last data update: 2014.03.03 |
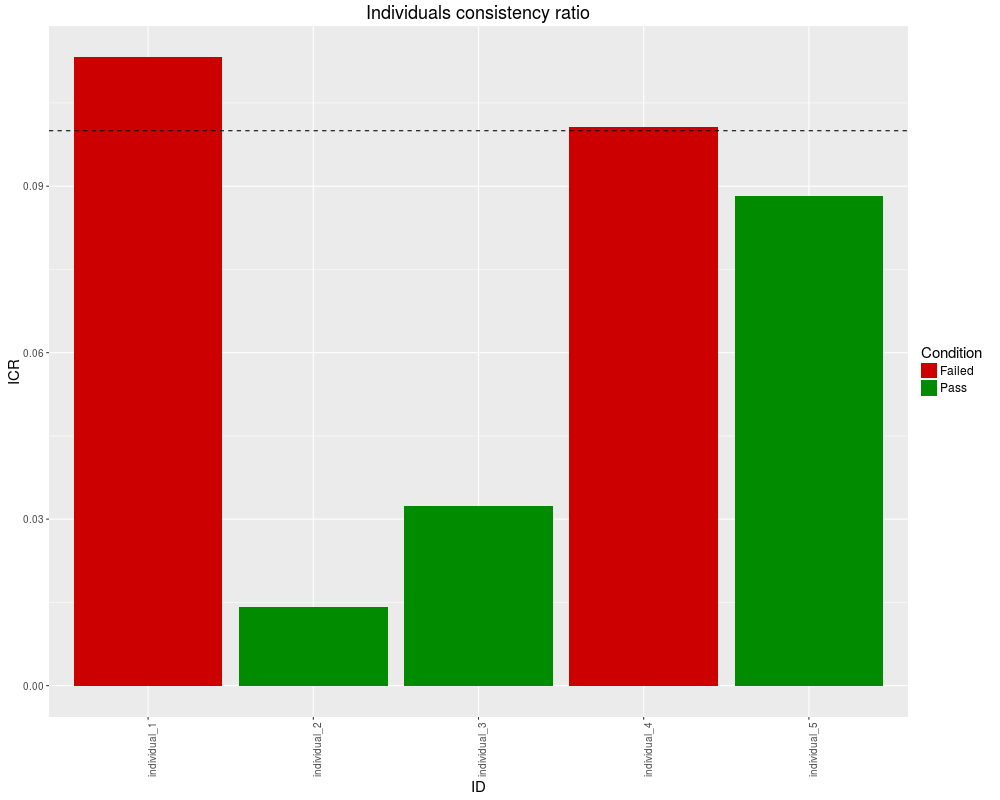
crplotDescriptionPlotting the consistency ratio (CR) of individual judgements. According to Satty, a pairwise comparison matrix is considered to be consistent if CR is equal or less than 0.1. Therefore, CRs equal to or less than 0.1 are colored in green (Pass) and CRs greater than 0.1 are colored in red (Failed). Usagecrplot(srcfile, fontsize = 15, xcex = 10, ycex = 10, angle = 90, xlab = "ID", ylab = "ICR", main = NULL) Arguments
ValueAn object created by 'ggplot'. Author(s)Daryanaz Dargahi Examples
data <- c(0.1132, 0.0142, 0.0324, 0.10075, 0.0883)
names(data) <- c('individual_1','individual_2','individual_3','individual_4','individual_5')
crplot(data, fontsize = 15, xcex = 10, ycex = 10, xlab = 'ID', ylab = 'ICR', main = 'Individuals consistency ratio')
Results
R version 3.3.1 (2016-06-21) -- "Bug in Your Hair"
Copyright (C) 2016 The R Foundation for Statistical Computing
Platform: x86_64-pc-linux-gnu (64-bit)

R is free software and comes with ABSOLUTELY NO WARRANTY.
You are welcome to redistribute it under certain conditions.
Type 'license()' or 'licence()' for distribution details.

R is a collaborative project with many contributors.
Type 'contributors()' for more information and
'citation()' on how to cite R or R packages in publications.

Type 'demo()' for some demos, 'help()' for on-line help, or
'help.start()' for an HTML browser interface to help.
Type 'q()' to quit R.

> library(Prize)
> png(filename="/home/ddbj/snapshot/RGM3/R_BC/result/Prize/crplot.Rd_%03d_medium.png", width=480, height=480)
> ### Name: crplot
> ### Title: crplot
> ### Aliases: crplot
>
> ### ** Examples
>
> data <- c(0.1132, 0.0142, 0.0324, 0.10075, 0.0883)
> names(data) <- c('individual_1','individual_2','individual_3','individual_4','individual_5')
> crplot(data, fontsize = 15, xcex = 10, ycex = 10, xlab = 'ID', ylab = 'ICR', main = 'Individuals consistency ratio')
>
>
>
>
>
> dev.off()
null device
          1
>
|
Created & Maintained by Osamu Ogasawara (osamu.ogasawara@gmail.com) and 