Supported by Dr. Osamu Ogasawara and  . . |
|
Last data update: 2014.03.03 |
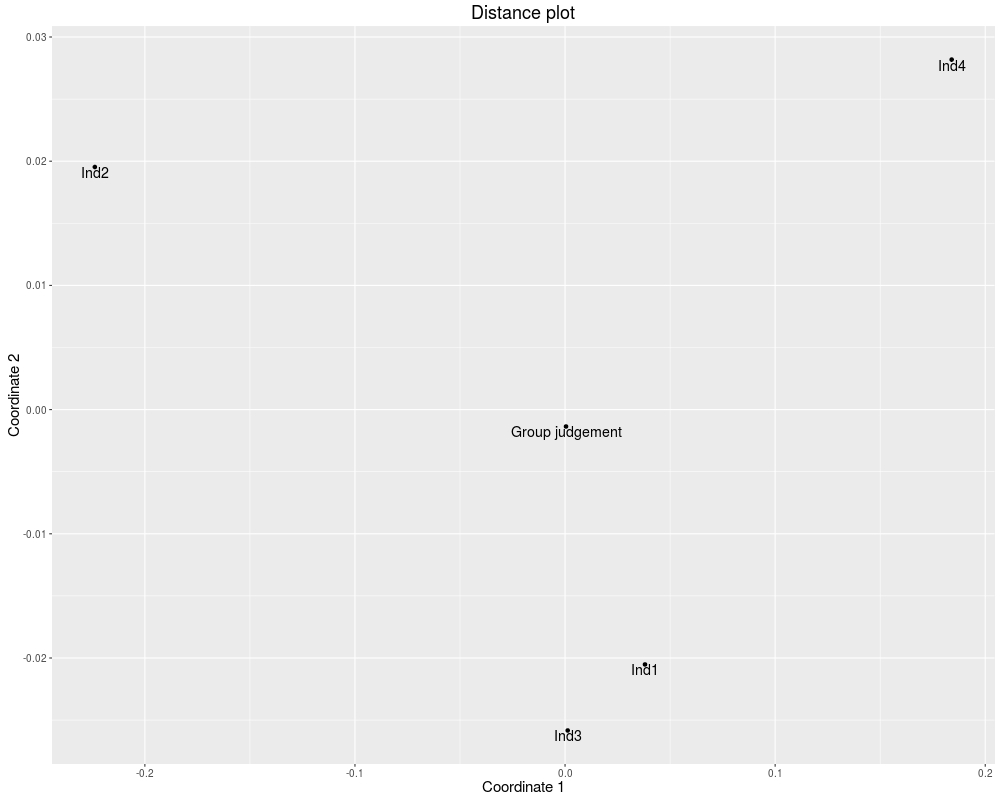
dplotDescriptionComputing and plotting the distance between individuals and group judgement. Distances are computed using classical multidimensional scaling (MDS) approach. Usagedplot(srcfile, fontsize = 15, xcex = 10, ycex = 10, lcex = 5, hjust = 0.5, vjust = 1, xlab = "Coordinate 1", ylab = "Coordinate 2", main = NULL) Arguments
ValueAn object created by 'ggplot'. Author(s)Daryanaz Dargahi ReferencesJ.C. Gower. Some distance properties of latent root and vector methods used in multivariate analysis. Biometrika, 53(3/4):pp. 325-338, 1966. Examples
mat <- matrix(nrow = 5, ncol = 4, data = NA)
rownames(mat) <- c('Ind1','Ind2','Ind3', 'Ind4' ,'Group judgement')
colnames(mat) <- c('Tumor_expression','Normal_expression','Frequency','Epitopes')
mat[1,] <- c(0.4915181, 0.3058879, 0.12487821, 0.07771583)
mat[2,] <- c(0.3060687, 0.4949012, 0.12868606, 0.07034399)
mat[3,] <- c(0.4627138, 0.3271881, 0.13574662, 0.07435149)
mat[4,] <- c(0.6208484, 0.2414021, 0.07368481, 0.06406465)
mat[5,] <- c(0.4697298, 0.3406738, 0.11600194, 0.07359445)

dplot(mat, xlab = 'Coordinate 1', ylab = 'Coordinate 2', main = 'Distance plot')
Results
R version 3.3.1 (2016-06-21) -- "Bug in Your Hair"
Copyright (C) 2016 The R Foundation for Statistical Computing
Platform: x86_64-pc-linux-gnu (64-bit)

R is free software and comes with ABSOLUTELY NO WARRANTY.
You are welcome to redistribute it under certain conditions.
Type 'license()' or 'licence()' for distribution details.

R is a collaborative project with many contributors.
Type 'contributors()' for more information and
'citation()' on how to cite R or R packages in publications.

Type 'demo()' for some demos, 'help()' for on-line help, or
'help.start()' for an HTML browser interface to help.
Type 'q()' to quit R.

> library(Prize)
> png(filename="/home/ddbj/snapshot/RGM3/R_BC/result/Prize/dplot.Rd_%03d_medium.png", width=480, height=480)
> ### Name: dplot
> ### Title: dplot
> ### Aliases: dplot
>
> ### ** Examples
>
> mat <- matrix(nrow = 5, ncol = 4, data = NA)
> rownames(mat) <- c('Ind1','Ind2','Ind3', 'Ind4' ,'Group judgement')
> colnames(mat) <- c('Tumor_expression','Normal_expression','Frequency','Epitopes')
> mat[1,] <- c(0.4915181, 0.3058879, 0.12487821, 0.07771583)
> mat[2,] <- c(0.3060687, 0.4949012, 0.12868606, 0.07034399)
> mat[3,] <- c(0.4627138, 0.3271881, 0.13574662, 0.07435149)
> mat[4,] <- c(0.6208484, 0.2414021, 0.07368481, 0.06406465)
> mat[5,] <- c(0.4697298, 0.3406738, 0.11600194, 0.07359445)
>
> dplot(mat, xlab = 'Coordinate 1', ylab = 'Coordinate 2', main = 'Distance plot')
>
>
>
>
>
> dev.off()
null device
          1
>
|