a numeric matrix with alternatives on the rows and criteria/subcriteria on the columns. alternative's AHP weights for each criteria, and the sum of each row on the last column (see example below).
range
specifies which alternatives to plot. Either provide a range (e.g. 1:5) or a vector of numbers (e.g. c(2,5,12,20)). if range is NULL then all alternatives will be plotted. The default value is NULL.
fontsize
the font size of the plot title, x and y axis labels, and legend. The default value is 10.
xcex
the font size of the labels on the bars. The default values is 4.
ycex
the font size of the y axis. The default values is 8.
color
the color palette to fill bars. Either provide a vector of n colors, where n is the number of criteria/subcriteria, or choose from the following palettes 'rainbow, heat, terrain, topo, cm'. The default value is rainbow.
xlab,ylab
the label of the x and y axis, respectively.
digit
the number of digits after decimal point to be shown on the bars. The default value is 3.
dist
the distance between the bar and its lable. The default value is 0.02.
R version 3.3.1 (2016-06-21) -- "Bug in Your Hair"
Copyright (C) 2016 The R Foundation for Statistical Computing
Platform: x86_64-pc-linux-gnu (64-bit)
R is free software and comes with ABSOLUTELY NO WARRANTY.
You are welcome to redistribute it under certain conditions.
Type 'license()' or 'licence()' for distribution details.
R is a collaborative project with many contributors.
Type 'contributors()' for more information and
'citation()' on how to cite R or R packages in publications.
Type 'demo()' for some demos, 'help()' for on-line help, or
'help.start()' for an HTML browser interface to help.
Type 'q()' to quit R.
> library(Prize)
> png(filename="/home/ddbj/snapshot/RGM3/R_BC/result/Prize/rainbowplot.Rd_%03d_medium.png", width=480, height=480)
> ### Name: rainbowplot
> ### Title: rainbowplot
> ### Aliases: rainbowplot
>
> ### ** Examples
>
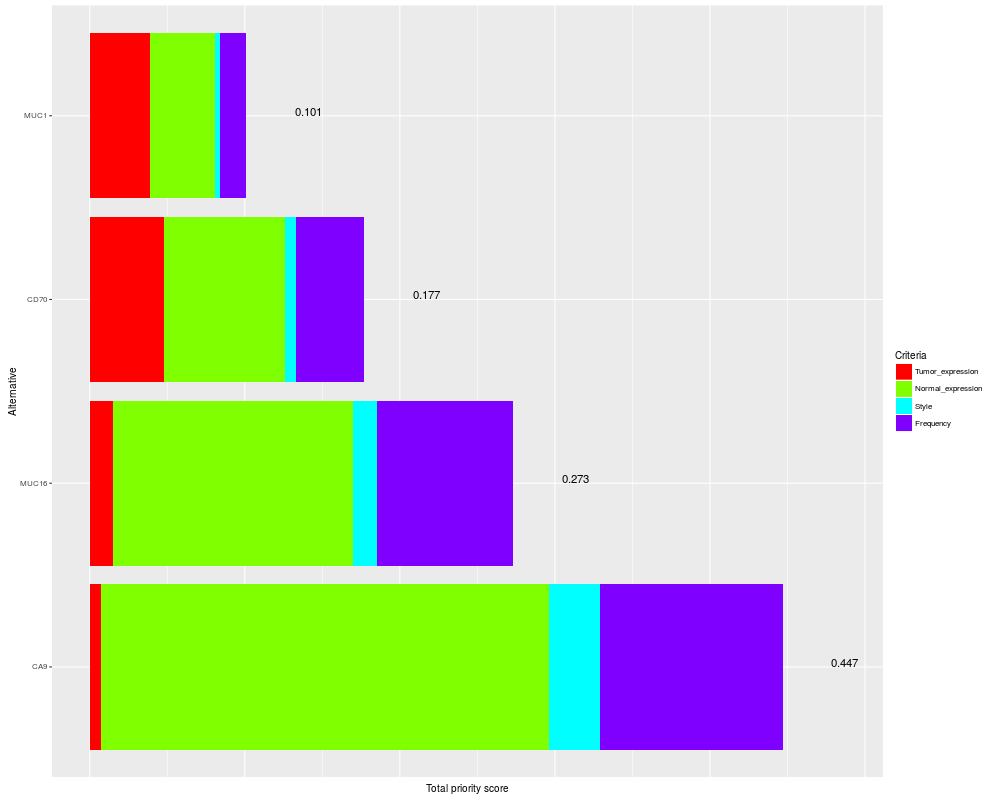
> mat <- matrix(c(0.007,0.289,0.033,0.118,0.447, 0.015,0.155,0.015,0.088,0.275, 0.048,0.078,0.007,0.044,0.177, 0.039,0.042,0.003,0.017,0.101),
+ nrow = 4, ncol = 5, byrow = TRUE, dimnames = list(c('CA9','MUC16','CD70','MUC1'), c('Tumor_expression','Normal_expression','Style','Frequency','Epitopes')))
> rainbowplot(mat, range = NULL, xlab = 'Total priority score' , ylab = 'Alternative', dist = 0.04)
>
>
>
>
>
> dev.off()
null device
1
>
 .
.