a matrix, where the first column includes criteria/subcriteria ID and the second includes the ahp weights.
color
the color palette to fill bars. Either provide a vector of n colors, where n is the number of criteria, or choose from the following palettes 'rainbow, heat, terrain, topo, cm'. The default value is rainbow.
fontsize
the font size of the plot title, and x and y axis labels. The default value is 15.
xcex,ycex
the font size of the x and y axis, respectively. The default values is 10.
pcex
the font size of the labels inside pie chart
digit
the number of digits after decimal point to be shown on the x axis.
xlab,ylab
the label of the x and y axis, respectively.
type
wplot offers two plot types; bar and pie plots. Default value is bar.
main
the plot title
Value
An object created by 'ggplot'.
Author(s)
Daryanaz Dargahi
Examples
mat <- matrix(nrow = 4, ncol = 2, data = NA)
mat[,1] <- c('Tumor_expression','Normal_expression','Frequency','Epitope')
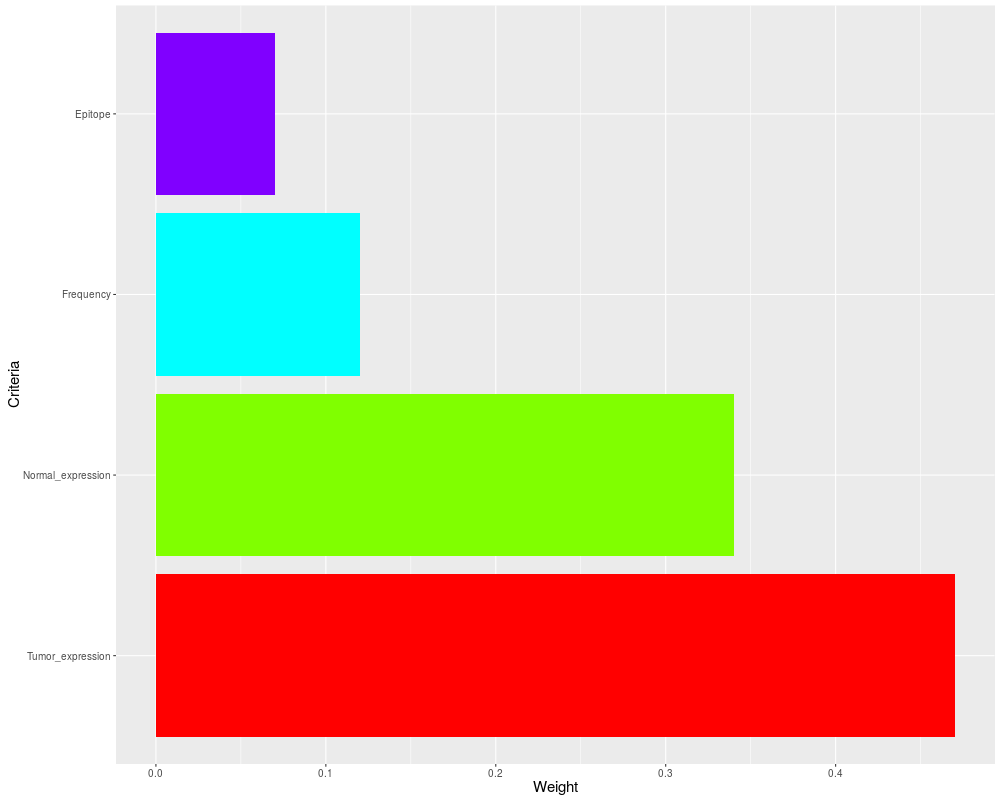
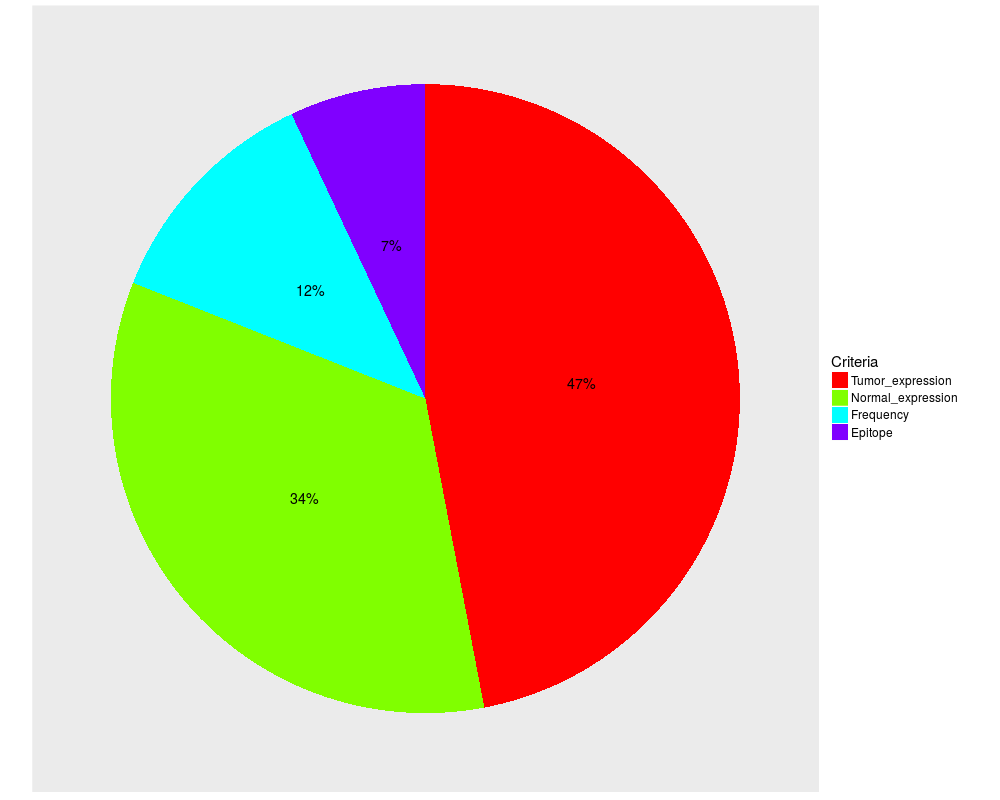
mat[,2] <- c(0.470, 0.341, 0.116, 0.073)
wplot(mat, xlab = 'Weight', ylab = 'Criteria', type = 'bar')
wplot(mat, type = 'pie')
Results
R version 3.3.1 (2016-06-21) -- "Bug in Your Hair"
Copyright (C) 2016 The R Foundation for Statistical Computing
Platform: x86_64-pc-linux-gnu (64-bit)

R is free software and comes with ABSOLUTELY NO WARRANTY.
You are welcome to redistribute it under certain conditions.
Type 'license()' or 'licence()' for distribution details.

R is a collaborative project with many contributors.
Type 'contributors()' for more information and
'citation()' on how to cite R or R packages in publications.

Type 'demo()' for some demos, 'help()' for on-line help, or
'help.start()' for an HTML browser interface to help.
Type 'q()' to quit R.

> library(Prize)
> png(filename="/home/ddbj/snapshot/RGM3/R_BC/result/Prize/wplot.Rd_%03d_medium.png", width=480, height=480)
> ### Name: wplot
> ### Title: Wplot
> ### Aliases: wplot
>
> ### ** Examples
>
> mat <- matrix(nrow = 4, ncol = 2, data = NA)
> mat[,1] <- c('Tumor_expression','Normal_expression','Frequency','Epitope')
> mat[,2] <- c(0.470, 0.341, 0.116, 0.073)
>
> wplot(mat, xlab = 'Weight', ylab = 'Criteria', type = 'bar')
> wplot(mat, type = 'pie')
>
>
>
>
>
> dev.off()
null device
          1
>
 .
.