Supported by Dr. Osamu Ogasawara and  . . |
|
Last data update: 2014.03.03 |
A SELDI-TOF data of 167 breast cancer and normal spectraDescriptionThis library contains both the raw spectra and the proto-biomarker data pre-processed by Ciphergen's software of the 167 samples. Those one hundred and sixty seven samples are collected from 155 subjects in CPT tubes with plasma isolated and stored in -80C until needed. Among the 167 samples, 55 are HER2 positive (A), 64 are normal healthy women (B), 35 are ER/PR positive (mostly) (C) and 13 samples are from a single healthy woman. Samples in group D are the only ones from a single subject, all the other samples represent draws from individual subjects. Samples were thawed and aliquoted into 100ul vials. The samples were fractionated to simplify the proteome into sub-proteomes. The fractions 4 and 5 (f45) were processed by the Ciphergen IMAC protocol with EAM of CHCA. Information on the spectrum
ID and the pheotype information is stored in the As an alternative, package SourceAlex Miron's Lab at the Dana-Farber Cancer Institute. Examples
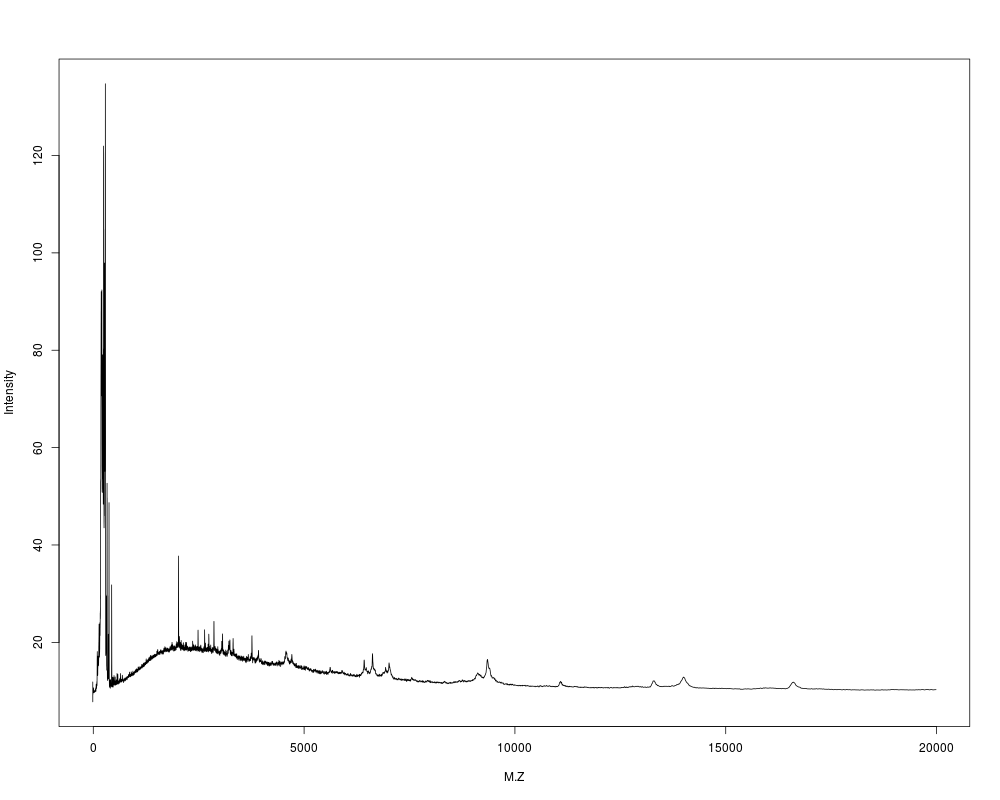
# plot a raw spectrum
f45c <- system.file("f45c", package="ProData")
fs <- dir(f45c,full.names=TRUE)
plot(read.csv(gzfile(fs[1])), type="l")

# find out sizes of phenotype groups:
library(Biobase)
data(f45cbmk)
SpecGrp <- pData(f45cbmk)
table(SpecGrp[,1])
Results
R version 3.3.1 (2016-06-21) -- "Bug in Your Hair"
Copyright (C) 2016 The R Foundation for Statistical Computing
Platform: x86_64-pc-linux-gnu (64-bit)

R is free software and comes with ABSOLUTELY NO WARRANTY.
You are welcome to redistribute it under certain conditions.
Type 'license()' or 'licence()' for distribution details.

R is a collaborative project with many contributors.
Type 'contributors()' for more information and
'citation()' on how to cite R or R packages in publications.

Type 'demo()' for some demos, 'help()' for on-line help, or
'help.start()' for an HTML browser interface to help.
Type 'q()' to quit R.

> library(ProData)
Loading required package: Biobase
Loading required package: BiocGenerics
Loading required package: parallel

Attaching package: 'BiocGenerics'

The following objects are masked from 'package:parallel':

    clusterApply, clusterApplyLB, clusterCall, clusterEvalQ,
    clusterExport, clusterMap, parApply, parCapply, parLapply,
    parLapplyLB, parRapply, parSapply, parSapplyLB

The following objects are masked from 'package:stats':

    IQR, mad, xtabs

The following objects are masked from 'package:base':

    Filter, Find, Map, Position, Reduce, anyDuplicated, append,
    as.data.frame, cbind, colnames, do.call, duplicated, eval, evalq,
    get, grep, grepl, intersect, is.unsorted, lapply, lengths, mapply,
    match, mget, order, paste, pmax, pmax.int, pmin, pmin.int, rank,
    rbind, rownames, sapply, setdiff, sort, table, tapply, union,
    unique, unsplit

Welcome to Bioconductor

    Vignettes contain introductory material; view with
    'browseVignettes()'. To cite Bioconductor, see
    'citation("Biobase")', and for packages 'citation("pkgname")'.

> png(filename="/home/ddbj/snapshot/RGM3/R_BC/result/ProData/ProData.Rd_%03d_medium.png", width=480, height=480)
> ### Name: ProData
> ### Title: A SELDI-TOF data of 167 breast cancer and normal spectra
> ### Aliases: ProData
> ### Keywords: datasets
>
> ### ** Examples
>
>
> # plot a raw spectrum
> f45c <- system.file("f45c", package="ProData")
> fs <- dir(f45c,full.names=TRUE)
> plot(read.csv(gzfile(fs[1])), type="l")
>
> # find out sizes of phenotype groups:
> library(Biobase)
> data(f45cbmk)
> SpecGrp <- pData(f45cbmk)
> table(SpecGrp[,1])

 A  B  C  D
55 64 35 13
>
>
>
>
>
> dev.off()
null device
          1
>
|