Candidate solutions to be plotted. ids=1 will draw the
plot for the maximum likelihood solution.
type
Different types of plots. "hist" will plot a histogram,
assigning log-ratio peaks to integer values. "overview" will plot all
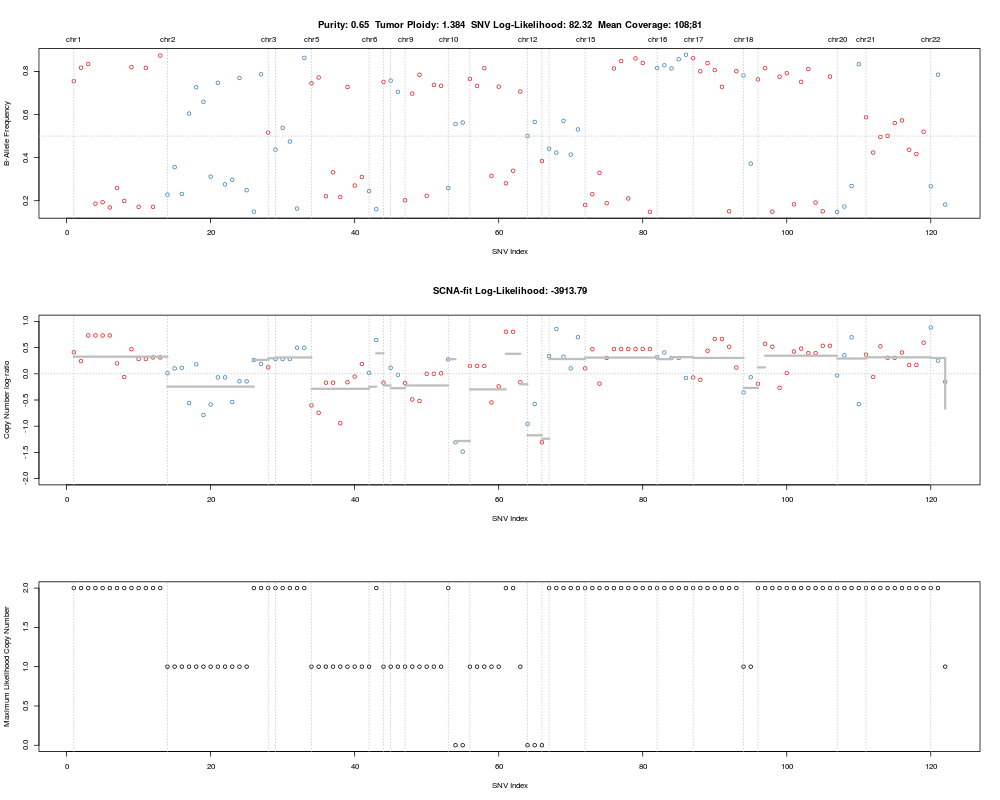
local optima, sorted by likelihood. "BAF" plots something like a B-allele
frequency plot known from SNP arrays: it plots allele frequencies of
germline variants (or most likely germline when status is not available)
against copy number. AF plots observed allelic fractions against expected
(purity), maximum likelihood (optimal multiplicity) allelic fractions.
"all" plots all, and is useful for generate a PDF for a sample for manual
inspection.
chr
If NULL, show all chromosomes, otherwise only the ones
specified (type=BAF only).
germline.only
If TRUE, show only variants most likely being germline in
BAF plot. Useful to set to FALSE (in combination with chr) to study
potential artifacts.
show.contour
For type overview, display contour plot.
purity
Display expected integer copy numbers for purity, defaults
to purity of the solution (type=hist only).
ploidy
Display expected integer copy numbers for ploidy, defaults
to ploidy of the solution (type=hist only).
...
Additonal parameters passed to the plot() function.
Value
Returns NULL
Author(s)
Markus Riester
Examples
data(purecn.example.output)
plotAbs(purecn.example.output, type="overview")
# plot details for the maximum likelihood solution (rank 1)
plotAbs(purecn.example.output, 1, type="hist")
plotAbs(purecn.example.output, 1, type="BAF")
Results
R version 3.3.1 (2016-06-21) -- "Bug in Your Hair"
Copyright (C) 2016 The R Foundation for Statistical Computing
Platform: x86_64-pc-linux-gnu (64-bit)

R is free software and comes with ABSOLUTELY NO WARRANTY.
You are welcome to redistribute it under certain conditions.
Type 'license()' or 'licence()' for distribution details.

R is a collaborative project with many contributors.
Type 'contributors()' for more information and
'citation()' on how to cite R or R packages in publications.

Type 'demo()' for some demos, 'help()' for on-line help, or
'help.start()' for an HTML browser interface to help.
Type 'q()' to quit R.

> library(PureCN)
Loading required package: DNAcopy
Loading required package: VariantAnnotation
Loading required package: BiocGenerics
Loading required package: parallel

Attaching package: 'BiocGenerics'

The following objects are masked from 'package:parallel':

    clusterApply, clusterApplyLB, clusterCall, clusterEvalQ,
    clusterExport, clusterMap, parApply, parCapply, parLapply,
    parLapplyLB, parRapply, parSapply, parSapplyLB

The following objects are masked from 'package:stats':

    IQR, mad, xtabs

The following objects are masked from 'package:base':

    Filter, Find, Map, Position, Reduce, anyDuplicated, append,
    as.data.frame, cbind, colnames, do.call, duplicated, eval, evalq,
    get, grep, grepl, intersect, is.unsorted, lapply, lengths, mapply,
    match, mget, order, paste, pmax, pmax.int, pmin, pmin.int, rank,
    rbind, rownames, sapply, setdiff, sort, table, tapply, union,
    unique, unsplit

Loading required package: GenomeInfoDb
Loading required package: stats4
Loading required package: S4Vectors

Attaching package: 'S4Vectors'

The following objects are masked from 'package:base':

    colMeans, colSums, expand.grid, rowMeans, rowSums

Loading required package: IRanges
Loading required package: GenomicRanges
Loading required package: SummarizedExperiment
Loading required package: Biobase
Welcome to Bioconductor

    Vignettes contain introductory material; view with
    'browseVignettes()'. To cite Bioconductor, see
    'citation("Biobase")', and for packages 'citation("pkgname")'.

Loading required package: Rsamtools
Loading required package: Biostrings
Loading required package: XVector

Attaching package: 'VariantAnnotation'

The following object is masked from 'package:base':

    tabulate

> png(filename="/home/ddbj/snapshot/RGM3/R_BC/result/PureCN/plotAbs.Rd_%03d_medium.png", width=480, height=480)
> ### Name: plotAbs
> ### Title: Plots for analyzing PureCN solutions
> ### Aliases: plotAbs
>
> ### ** Examples
>
> data(purecn.example.output)
> plotAbs(purecn.example.output, type="overview")
> # plot details for the maximum likelihood solution (rank 1)
> plotAbs(purecn.example.output, 1, type="hist")
> plotAbs(purecn.example.output, 1, type="BAF")
>
>
>
>
>
> dev.off()
null device
          1
>
 .
.