Supported by Dr. Osamu Ogasawara and  . . |
|
Last data update: 2014.03.03 |
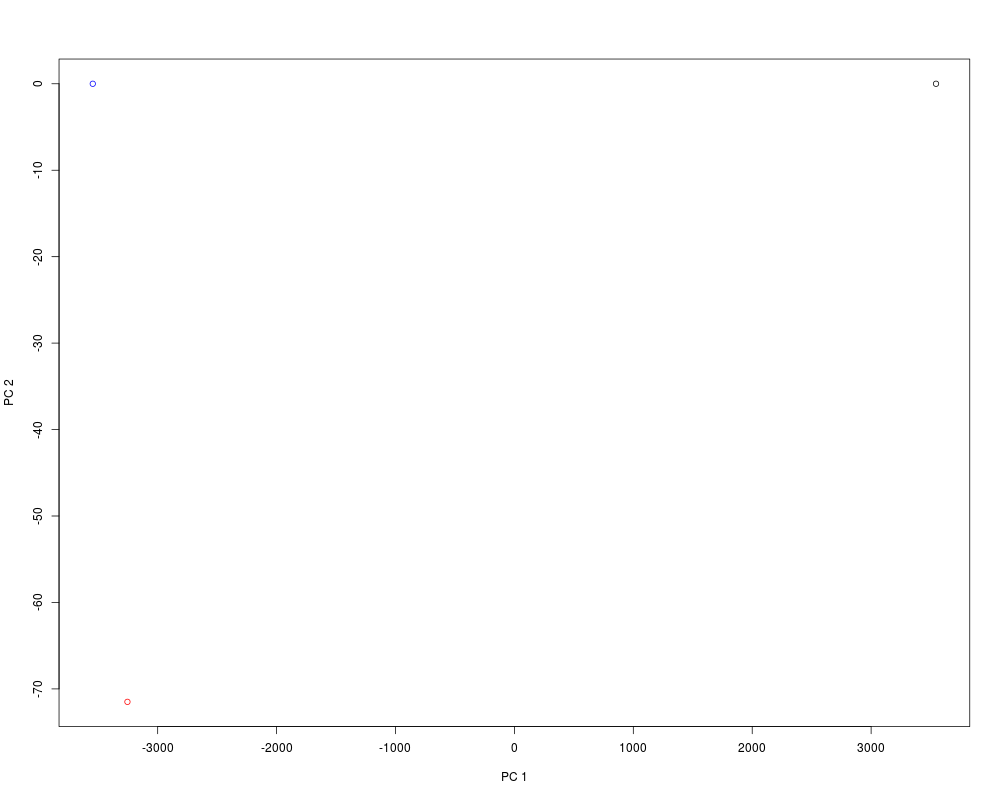
Plot the PCA of tumor and its best normal(s)DescriptionThis function can be used to understand how a best normal is chosen by the findBestNormal function. It can be also used to tune the best normal selection by finding good parameter values for num.normals and pcs. UsageplotBestNormal(gatk.normal.files, gatk.tumor.file,
normalDB, x = 1, y = 2, col.tumor = "red", col.best.normal = "blue",
col.other.normals = "black", ...)
Arguments
ValueReturns NULL Author(s)Markus Riester Examples
gatk.normal.file <- system.file("extdata", "example_normal.txt",
    package="PureCN")
gatk.normal2.file <- system.file("extdata", "example_normal2.txt",
     package="PureCN")
gatk.normal.files <- c(gatk.normal.file, gatk.normal2.file)
normalDB <- createNormalDatabase(gatk.normal.files)

gatk.tumor.file <- system.file("extdata", "example_tumor.txt",
    package="PureCN")
gatk.best.normal.file <- findBestNormal(gatk.tumor.file, normalDB)
plotBestNormal(gatk.best.normal.file, gatk.tumor.file, normalDB)
Results
R version 3.3.1 (2016-06-21) -- "Bug in Your Hair"
Copyright (C) 2016 The R Foundation for Statistical Computing
Platform: x86_64-pc-linux-gnu (64-bit)

R is free software and comes with ABSOLUTELY NO WARRANTY.
You are welcome to redistribute it under certain conditions.
Type 'license()' or 'licence()' for distribution details.

R is a collaborative project with many contributors.
Type 'contributors()' for more information and
'citation()' on how to cite R or R packages in publications.

Type 'demo()' for some demos, 'help()' for on-line help, or
'help.start()' for an HTML browser interface to help.
Type 'q()' to quit R.

> library(PureCN)
Loading required package: DNAcopy
Loading required package: VariantAnnotation
Loading required package: BiocGenerics
Loading required package: parallel

Attaching package: 'BiocGenerics'

The following objects are masked from 'package:parallel':

    clusterApply, clusterApplyLB, clusterCall, clusterEvalQ,
    clusterExport, clusterMap, parApply, parCapply, parLapply,
    parLapplyLB, parRapply, parSapply, parSapplyLB

The following objects are masked from 'package:stats':

    IQR, mad, xtabs

The following objects are masked from 'package:base':

    Filter, Find, Map, Position, Reduce, anyDuplicated, append,
    as.data.frame, cbind, colnames, do.call, duplicated, eval, evalq,
    get, grep, grepl, intersect, is.unsorted, lapply, lengths, mapply,
    match, mget, order, paste, pmax, pmax.int, pmin, pmin.int, rank,
    rbind, rownames, sapply, setdiff, sort, table, tapply, union,
    unique, unsplit

Loading required package: GenomeInfoDb
Loading required package: stats4
Loading required package: S4Vectors

Attaching package: 'S4Vectors'

The following objects are masked from 'package:base':

    colMeans, colSums, expand.grid, rowMeans, rowSums

Loading required package: IRanges
Loading required package: GenomicRanges
Loading required package: SummarizedExperiment
Loading required package: Biobase
Welcome to Bioconductor

    Vignettes contain introductory material; view with
    'browseVignettes()'. To cite Bioconductor, see
    'citation("Biobase")', and for packages 'citation("pkgname")'.

Loading required package: Rsamtools
Loading required package: Biostrings
Loading required package: XVector

Attaching package: 'VariantAnnotation'

The following object is masked from 'package:base':

    tabulate

> png(filename="/home/ddbj/snapshot/RGM3/R_BC/result/PureCN/plotBestNormal.Rd_%03d_medium.png", width=480, height=480)
> ### Name: plotBestNormal
> ### Title: Plot the PCA of tumor and its best normal(s)
> ### Aliases: plotBestNormal
>
> ### ** Examples
>
> gatk.normal.file <- system.file("extdata", "example_normal.txt",
+     package="PureCN")
> gatk.normal2.file <- system.file("extdata", "example_normal2.txt",
+      package="PureCN")
> gatk.normal.files <- c(gatk.normal.file, gatk.normal2.file)
> normalDB <- createNormalDatabase(gatk.normal.files)
Allosome coverage appears to be missing, cannot determine sex.
Allosome coverage appears to be missing, cannot determine sex.
>
> gatk.tumor.file <- system.file("extdata", "example_tumor.txt",
+     package="PureCN")
> gatk.best.normal.file <- findBestNormal(gatk.tumor.file, normalDB)
> plotBestNormal(gatk.best.normal.file, gatk.tumor.file, normalDB)
>
>
>
>
>
> dev.off()
null device
          1
>
|
Created & Maintained by Osamu Ogasawara (osamu.ogasawara@gmail.com) and 