Either a logical specifying whether to filter based on
loess residuals of the calibration set, or if a numeric, the cutoff
as number of standard deviations estimated with
madDiff to use for. Default is TRUE, which
corresponds to 4.0 standard deviations.
blacklist
Either a logical specifying whether to filter based on
overlap with blacklisted regions, or if numeric, the maximum
percentage of overlap allowed. Default is TRUE, which corresponds to
no overlap allowd (i.e. value of 0).
mappability
A numeric in [0,100] to specify filtering out
bins with mappabilities lower than the number specified. NA (default)
or FALSE will not filter based on mappability.
bases
A numeric specifying the minimum percentage of characterized
bases (not Ns) in the reference genome sequence. NA (default) or
FALSE will not filted based on uncharacterized bases.
type
When specifying multiple filters (residual,
blacklist, mappability, bases), whether to
highlight their union (default) or intersection.
R version 3.3.1 (2016-06-21) -- "Bug in Your Hair"
Copyright (C) 2016 The R Foundation for Statistical Computing
Platform: x86_64-pc-linux-gnu (64-bit)
R is free software and comes with ABSOLUTELY NO WARRANTY.
You are welcome to redistribute it under certain conditions.
Type 'license()' or 'licence()' for distribution details.
R is a collaborative project with many contributors.
Type 'contributors()' for more information and
'citation()' on how to cite R or R packages in publications.
Type 'demo()' for some demos, 'help()' for on-line help, or
'help.start()' for an HTML browser interface to help.
Type 'q()' to quit R.
> library(QDNAseq)
> png(filename="/home/ddbj/snapshot/RGM3/R_BC/result/QDNAseq/highlightFilters.Rd_%03d_medium.png", width=480, height=480)
> ### Name: highlightFilters
> ### Title: Highlights data points in a plotted profile to evaluate
> ### filtering
> ### Aliases: highlightFilters highlightFilters,QDNAseqSignals-method
> ### Keywords: aplot
>
> ### ** Examples
>
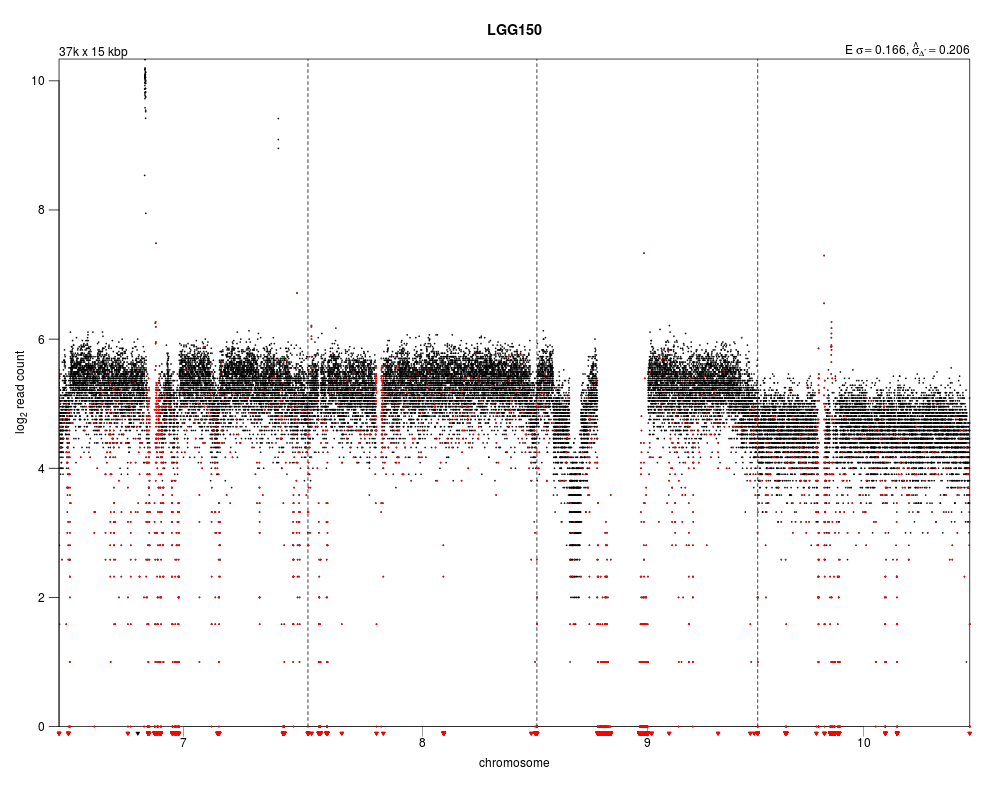
> data(LGG150)
> readCounts <- LGG150
> plot(readCounts)
Plotting sample LGG150 (1 of 1) ...
> highlightFilters(readCounts, residual=TRUE, blacklist=TRUE)
Highlighted 3,375 bins.
>
>
>
>
>
> dev.off()
null device
1
>
 .
.