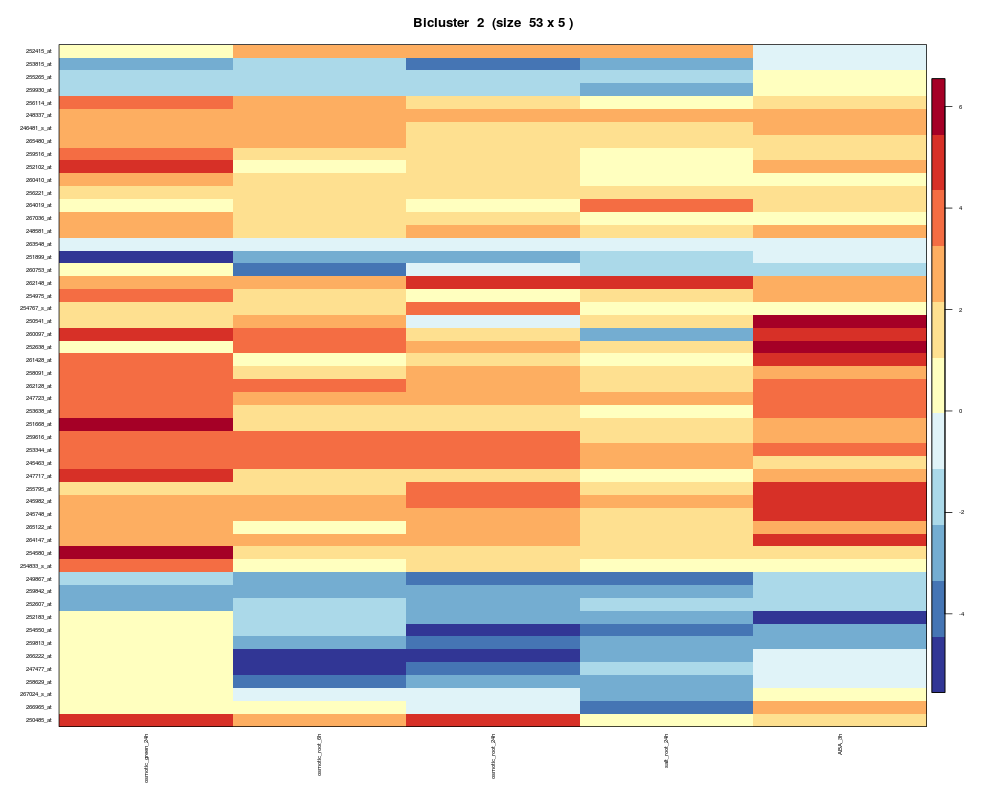
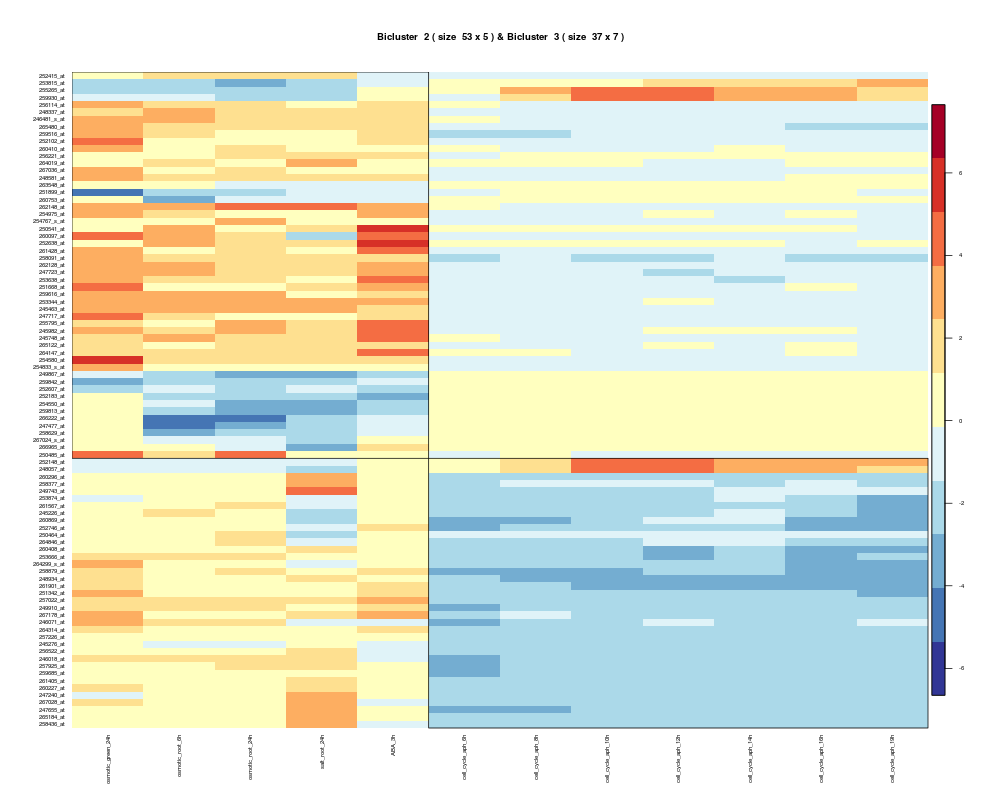
This function can visualize the identifed biclusters using heatmap in support of overall expression pattern analysis,either for a single bicluster or two biclusters.
R version 3.3.1 (2016-06-21) -- "Bug in Your Hair"
Copyright (C) 2016 The R Foundation for Statistical Computing
Platform: x86_64-pc-linux-gnu (64-bit)

R is free software and comes with ABSOLUTELY NO WARRANTY.
You are welcome to redistribute it under certain conditions.
Type 'license()' or 'licence()' for distribution details.

R is a collaborative project with many contributors.
Type 'contributors()' for more information and
'citation()' on how to cite R or R packages in publications.

Type 'demo()' for some demos, 'help()' for on-line help, or
'help.start()' for an HTML browser interface to help.
Type 'q()' to quit R.

> library(QUBIC)
Loading required package: biclust
Loading required package: MASS
Loading required package: grid
Loading required package: colorspace
Loading required package: lattice
> png(filename="/home/ddbj/snapshot/RGM3/R_BC/result/QUBIC/quheatmap.Rd_%03d_medium.png", width=480, height=480)
> ### Name: quheatmap
> ### Title: Visualization of identified biclusters
> ### Aliases: quheatmap
>
> ### ** Examples
>
> # Load microarray matrix
> data(BicatYeast)
> res <- biclust::biclust(BicatYeast, method=BCQU(), verbose = FALSE)
> # Draw heatmap for the 2th identified bicluster
> par(mar = c(5, 4, 3, 5) + 0.1, mgp = c(0, 1, 0), cex.lab = 1.1, cex.axis = 0.5, cex.main = 1.1)
> quheatmap(x = BicatYeast, res, number = 2, showlabel = TRUE)
Loading required namespace: fields
> # Draw heatmap for the 2th and 3th identified biclusters.
> par(mar = c(5, 5, 5, 5), cex.lab = 1.1, cex.axis = 0.5, cex.main = 1.1)
> quheatmap(x = BicatYeast, res, number = c(2, 3), showlabel = TRUE)
[1] "yto 0"
[1] "xlo 0"
>
>
>
>
>
> dev.off()
null device
          1
>
 .
.